ohsomeNow is a dashboard that provides an overview of OpenStreetMap (OSM) mapping activities in near real time. The tool covers all OSM contributions going back to 2005 and updates its data every minute. Statistics are calculated on the fly, giving users the flexibility to explore activity across any time range, filtered by country and/or hashtag.
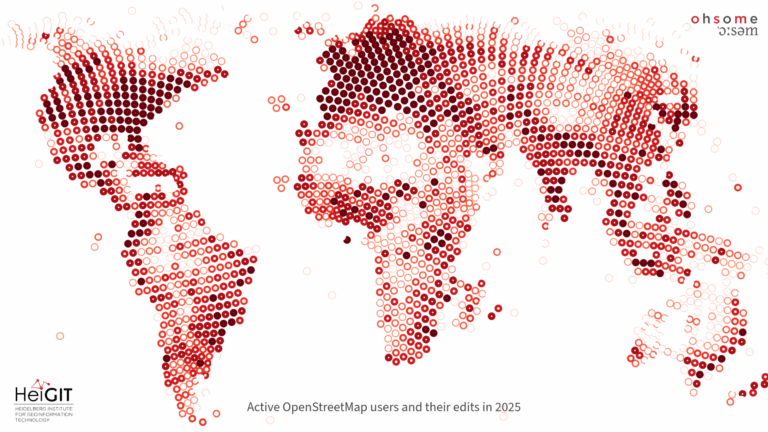
To date, almost 2.4 million people have contributed to OSM, with around 50,000 active mappers each month in 2025, collectively accounting for over 3.2 billion contributions since 2005. Making sense of this wealth of data is what the dashboard is built for, offering insights into the number of contributors, total map edits, added buildings, and road length added.
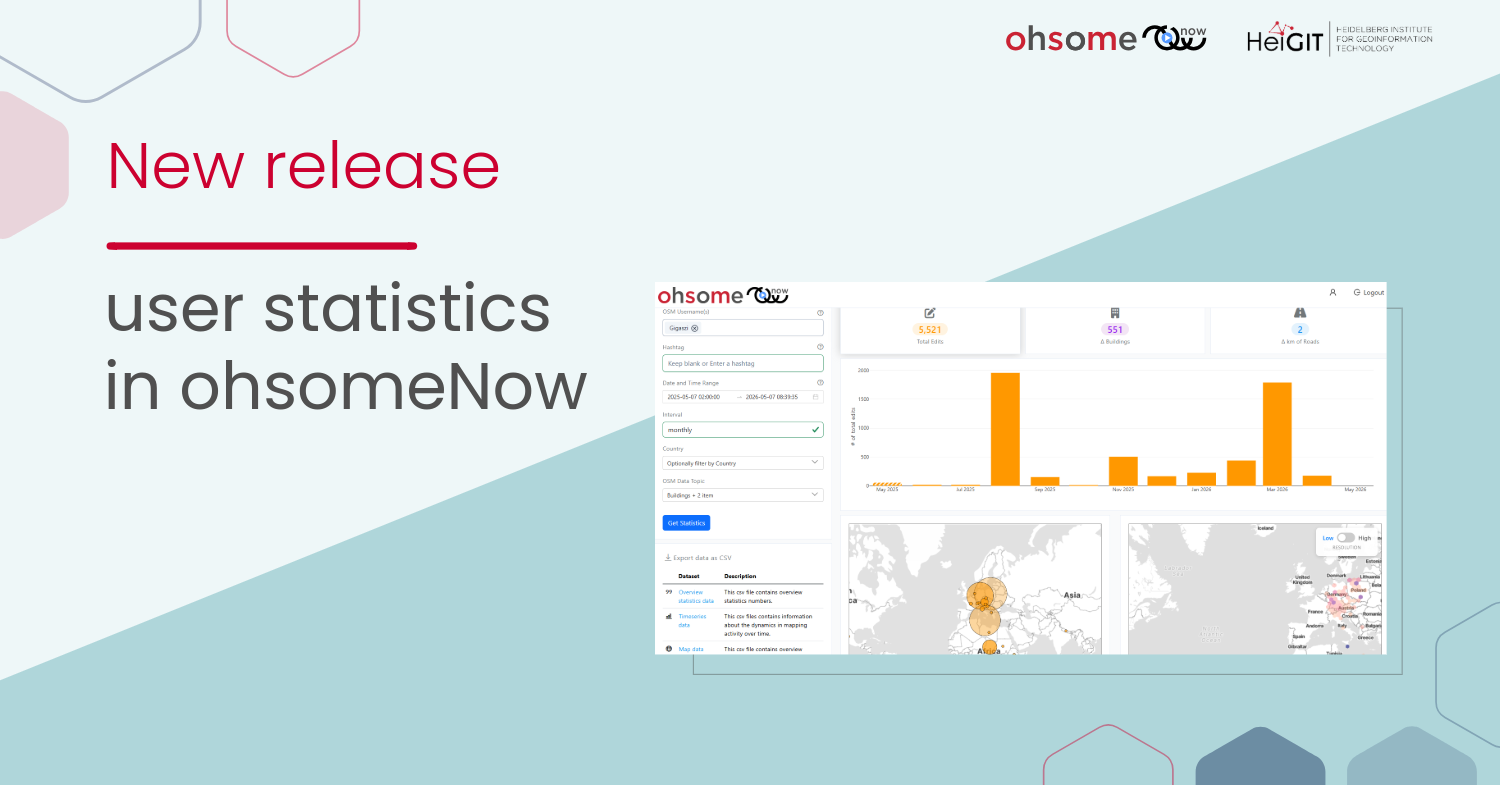
New release
With the new release, ohsomeNow allows you to retrieve statistics for individual OSM contributors by entering their usernamein the search bar. By logging in with a HeiGIT account, mappers can explore their own personal contribution history in the same depth and flexibility the dashboard already offers for campaigns and countries. With ohsomeNow you can now also better understand organized editing activities by paid contributors, e.g. for companies that do not use a changeset hashtag for their edits but report the number of OSM contributors that map for them. For instance, here you can see that Meta’s US-based mapping team is primarily focusing on road mapping in larger US cities.
This release is part of a broader effort, bringing all of HeiGIT service under single-sign-on, allowing users to switch between tools, view their own statistics, and manage their API keys.
As part of this ecosystem, ohsomeNow also supports HOT Tasking Manager instances. If you host your own regional or specialized Tasking Manager instance, our ohsomeNow API can provide statistics on both the overall mapping progress and the individual users contributing to it. To get started, simply create a HeiGIT account.
Example of the new feature from the LaVerDi project
To illustrate what the new user statistics feature looks like in practice, here is an example from our colleagues‘ current research. The LaVerDi project explores how OpenStreetMap data can complement satellite imagery for tracking land cover changes in Germany. To better differentiate OSM tagging logic, our colleagues are looking into how residential areas are mapped and, whether they are tagged as fully bricked (sealed surface). It is important because not every residential zone is entirely paved, and these mapping discrepancies turn out to have a statistically significant impact when calculating the total sealed area across Germany.
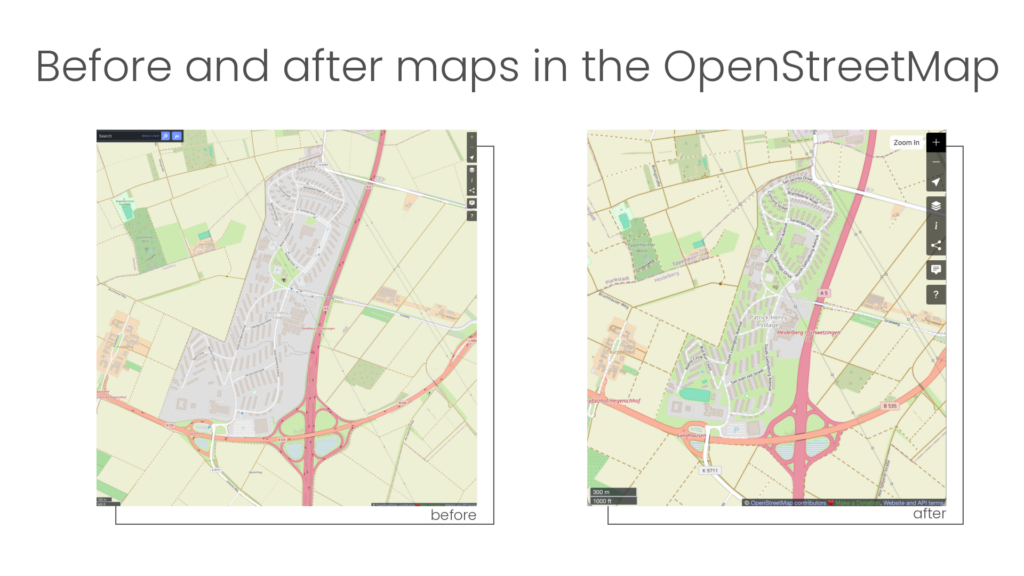
To address this and track the progress of their correction campaign, the team introduced the hashtag #makegermanygreenagain. With the new user statistics feature, you can go even further and follow the individual contributions of each mapper taking part in the campaign: mrkhan and Gigaszi. Below you can see the intermediate results of their mapping work, uncovering a surprising amount of „lost“ greenery.
With the updated dashboard, you can now follow who is contributing, how many edits each mapper has made, and how activity evolves over time. Log in with your HeiGIT account and explore mapper and campaign statistics at ohsome-now.heigit.org. Whether you are coordinating a humanitarian response, running a research campaign, or curious about your own contribution history, ohsomeNow will turn raw edits into mapping insights.