Cities are where climate action has the greatest potential and where open geospatial data can be used most effectively, given that by 2050, 70 % of the world’s population will be living in cities. Having limited resources, cities and public administrations need fine-grained, actionable data to improve urban infrastructure in an effective way. This is where open geospatial data has great potential to help.
“To build climate-resilient cities, we need real-world perspectives and reliable data”, explains Kirsten von Elverfeldt, Community engagement manager for climate action at HeiGIT. “Our mission is to bring together technical expertise and local knowledge to help cities rethink infrastructure and make it fit for the future.”
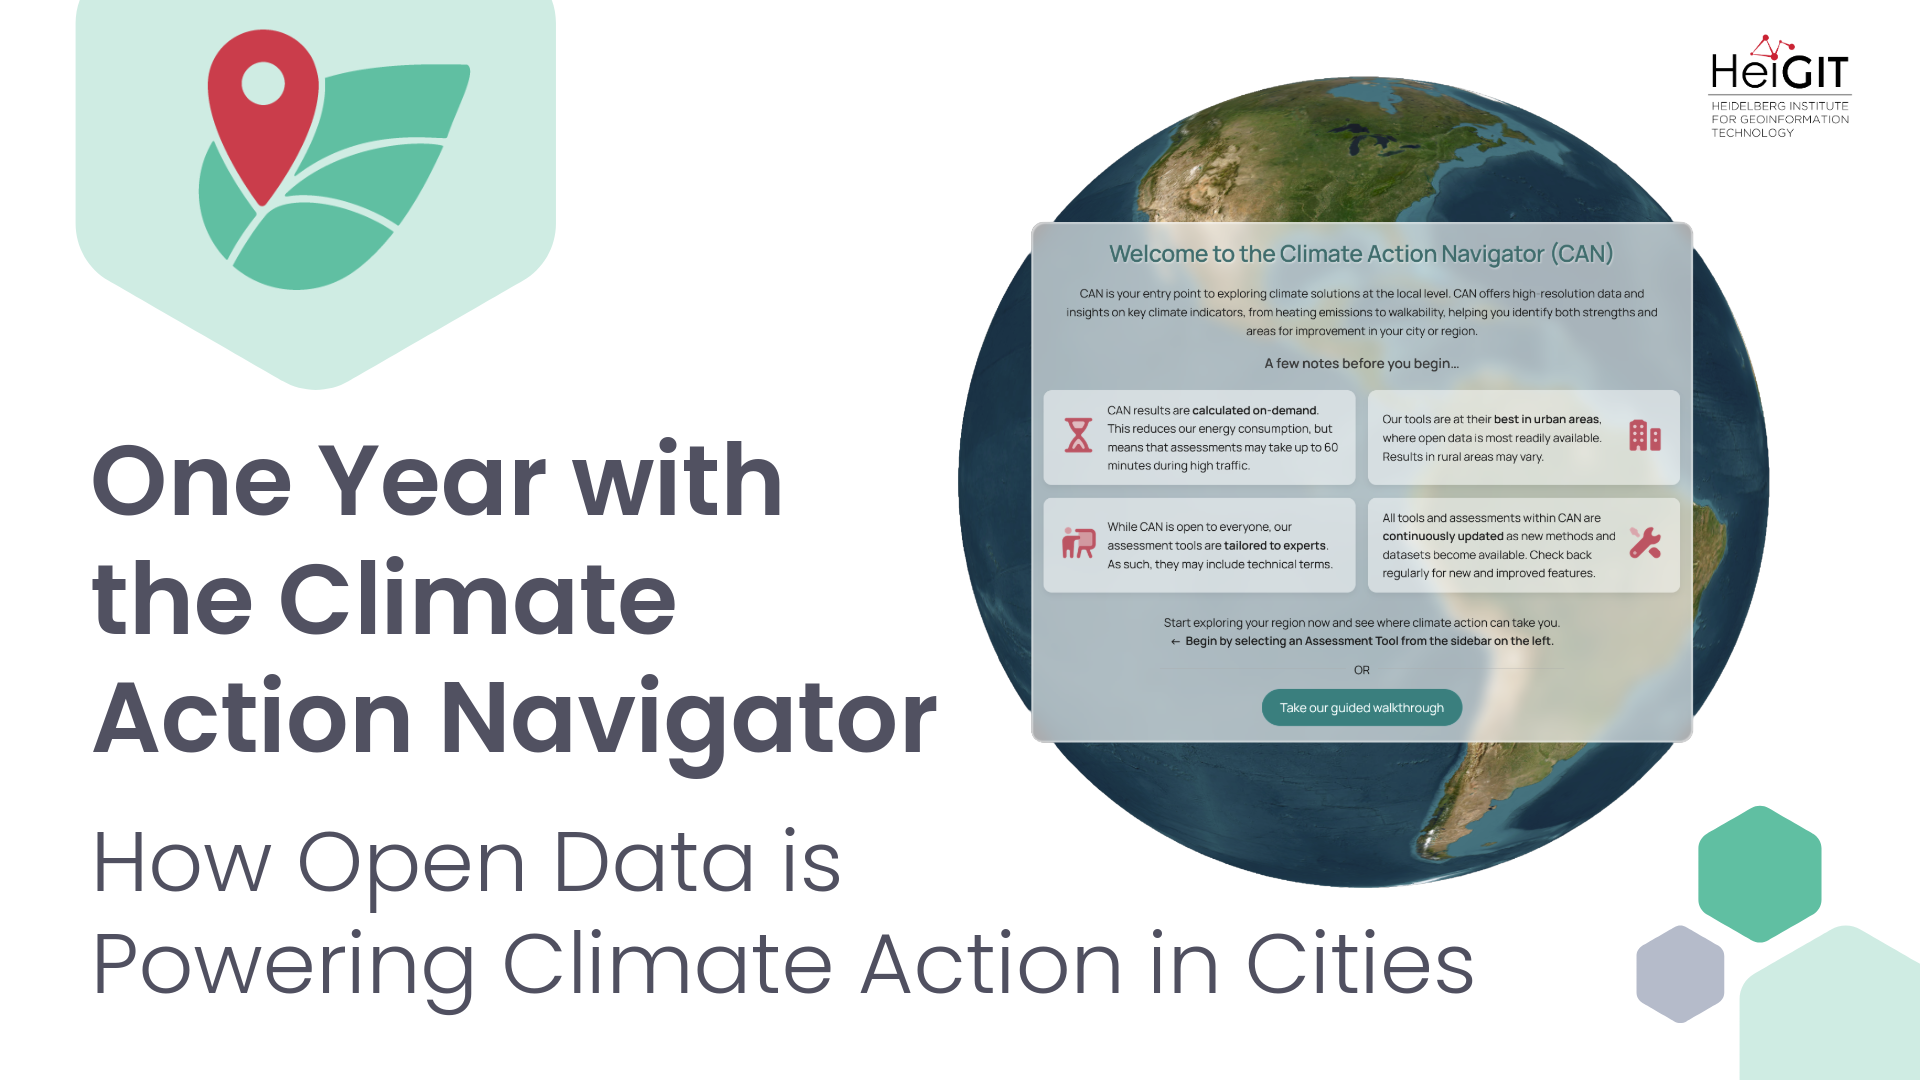
This was the idea that drove us to establish a Climate Action focus group at HeiGIT. Out of this idea, the Climate Action Navigator (CAN) was officially launched in June 2025: an open, interactive dashboard to aid urban climate action. One year later, the Climate Action Navigator stands as a free source for maps and reports at high resolution for an array of climate-related urban aspects. It has already helped NGOs, urban planners, and local initiatives pinpoint how to effectively act in their neighborhoods and keeps growing and changing to fit the needs of its users.
A Living Dashboard for Climate Action
It all started with the first step, with the launch of a walkability assessment tool: hiWalk assesses the quality and accessibility of urban walking infrastructure, e. g., whether sidewalks are available, or how pleasant and safe an area is for pedestrians. Soon followed a similar assessment tool for bikeability, hiBike, which assesses how bicycle-friendly a city, neighborhood, or street is, covering another key aspect of sustainable mobility.
Of course, there is more to climate-friendly city planning than active mobility, with emission monitoring also playing a key part. This is why we had two more modules in the first version of the Climate Action Navigator: the Heating Emissions assessment tool, which shows where CO2 emissions from residential heating are highest, and the LULC Change assessment tool, which estimates the carbon emissions resulting from land use and land cover changes over a selected time period and area.
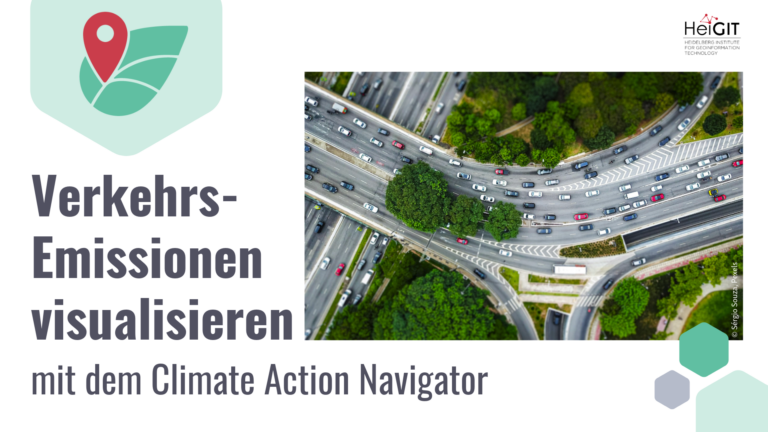
The interest in the first modules of the Climate Action Navigator and the fruitful collaboration with project partners and users enabled us to quickly expand the CAN dashboard with new modules. Within the last year, we launched an assessment tool to estimate how much of a city’s carbon budget remains to stay within global emission targets (CO₂ Budget), a module that shows how land is being used across a given area (Land Consumption), and the Traffic Emissions assessment tool, which maps transport-related emissions at street level.
At the same time, users´ feedback and the latest research studies were incorporated into the existing assessment tools, which have been growing with new features, such as mobility-related indicators like benches and drinking fountains as well as greenness and detours, but also insights on heating-related emissions such as construction year and energy carrier of buildings.
Powered by Co-Creation and Grounded in Scientific Research
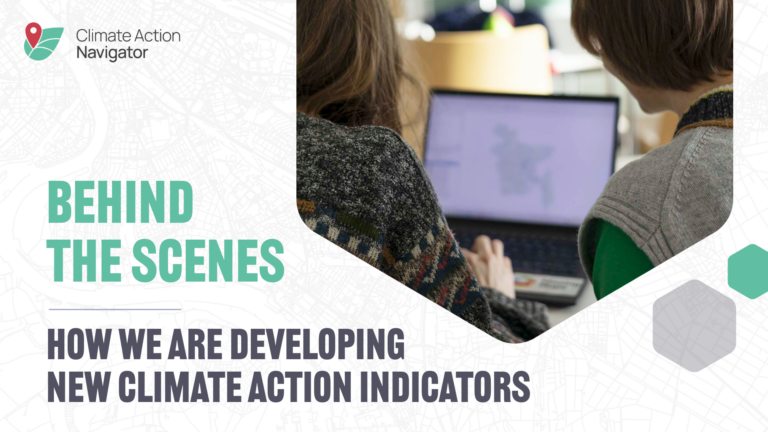
The Climate Action Navigator is developed in close collaboration with our partners: each tool starts from real use cases and is tested against the specific needs of our users. This co-creation process is key to providing indicators that truly reflect the reality on the ground and the needs of city administrations, NGOs, and community initiatives that use them.
The current indicators on the CAN dashboard were shaped by the co-development, needs, and feedback of partners like GLEN (German Longitudinal Environmental Study), ILS (German Research Institute for Regional and Urban Development), Institute of Environmental Physics at Heidelberg University, Klimanetz, Lagos Urban Development Initiative, Planum, Radlobby, Someware, Urban Innovation – Stadt neu denken! e.V., and Walk-space.at.
During the first development phase of CAN, the Austrian national cycling association RadLobby Österreich helped HeiGIT develop the bikeability tool hiBike and used it to evaluate how easily and safely children can ride a bike to school in Carinthia, Austria, analyzing the bike paths to nearly 140 schools in the region. Gerald Schumer, managing director of Radlobby Österreich, explains how this cooperation has helped its organization advocate for more bike-friendly infrastructure: “The assessment tool hiBike delivers a solid base for us to present the results to the responsible authorities, sharpen public awareness around this topic, and improve biking conditions, especially for children. hiBike really eases our work and makes us a stronger voice for biking.”
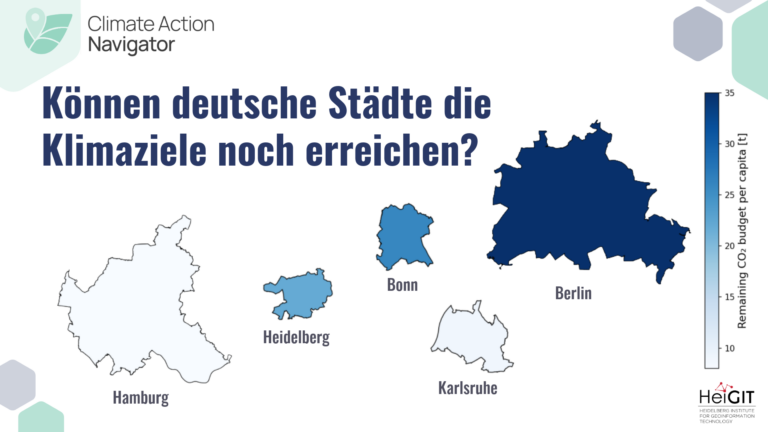
Also the climate activism movement Klimanetz Heidelberg partnered up with HeiGIT to develop the assessment tool CO2 Budgets. “In the climate debate, the global perspective is, of course, of great importance. Yet, relevant decisions are also made on the municipal level,” reflects Niko Krasowski, member of Klimanetz Heidelberg. “With the tools that HeiGIT provided, the Municipal Environmental Office in Heidelberg is able to evaluate whether the city´s plans for emission reduction are aligned with the Paris agreement. And we as civil society actors can hold them accountable with a strong data foundation: a necessary step towards evidence-based decision making.”
Looking Ahead: Roadmap for Year Two
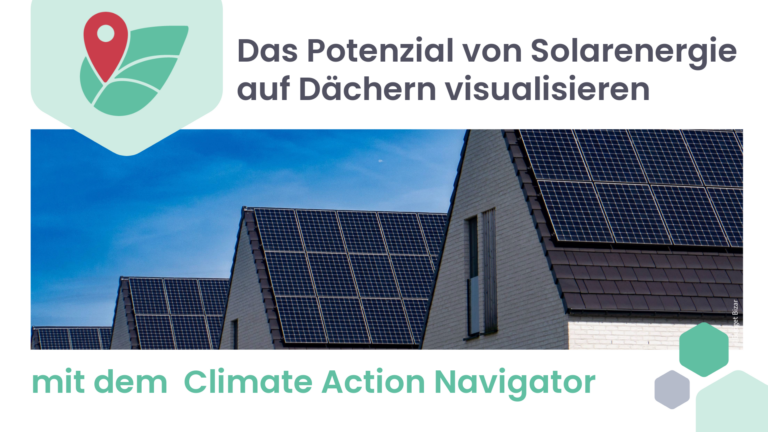
The Climate Action Navigator is always in progress. We are working on several new assessment tools to expand the CAN dashboard: a transitability tool that assesses the availability and quality of public transport options, maps of solar PV (photovoltaic) panels mounted on building rooftops, and a module to assess greenhouse gas emissions from wastewater treatment plants. Moreover, the walkability and bikeability assessment tools will be further enriched with indicators on shade and slope.
While some indicators are currently available only for selected cities or only for Germany due to data scarcity or other constraints, we strive to expand the availability of our assessment tool globally, as we already did with hiWalk, hiBike, and Land Consumption, and we welcome collaborations and expressions of interest from communities all over the world.
Get started with the Climate Action Navigator by creating a free user account and exploring your neighborhood with the assessment tools. If you want to contribute to the development of the indicators, we welcome collaboration with NGOs, citizens’ initiatives, or city administrations with specific use cases. We also invite research institutions interested in contributing to the scientific foundation of our tools. Contact us at climate-action-navigator@heigit.org.