A framework for better data on wheelchair accessibility
Sometimes, an otherwise perfectly fine sidewalk narrows down in a certain spot, or an obstacle blocks a few meters of it, or the concrete pavement is partially replaced by gravel and grass. For most pedestrians this is just a mild annoyance or a small detour. For a wheelchair user, it means that the sidewalk is not passable and maybe the entire route is not feasible at all.
Urban space is not equally accessible to all city inhabitants. If we want to improve urban accessibility in our cities, urban planners and other policy makers need detailed data on where barriers exist, because a single barrier can make a route impossible for a wheelchair user to traverse independently.
This study presents a processing pipeline that leverages street-level imagery and deep learning techniques to produce wheelchair accessibility data that is reliable, scalable, and actionable.
Building on previous work with processing street-level imagery, we developed new methods to create a Wheelchair Accessibility Dataset (WHAD), which provides high-resolution data on cities´ accessibility from a wheelchair user’s perspective, and a composite sidewalk Wheelchair Accessibility Index (WHAI) that is explainable, can be validated, and is transferable across cities and regions.
In this work, only open data and methods were used, making the solution open to researchers and practitioners who want to incorporate it into their systems, such as routing tools, and to anyone with a stake in how wheelchair-friendly a city is.
What the framework measures
With the proposed method, we can assess accessibility for wheelchair users based on four sidewalk characteristics:
- Sidewalk width: Narrow paths restrict maneuverability and can block the path or force wheelchair users into road traffic, which significantly increases the risk of accidents.
- Slope: Steep paths, especially those exceeding recommended thresholds, can make sidewalks impassable. Uphill segments increase physical exertion for manual wheelchair users, and downhill segments can affect braking control and safety for all wheelchair users.
- Surface type: Asphalt and concrete provide a safe and stable setting. Gravel and grass are likely to be uneven and increase physical effort.
- Surface condition: Sidewalks in poor condition, for example with potholes and cracks, impede movement and increase safety risk.
Data sources and processing steps
To gather information on all factors above, the pipeline is based on three main external data sources:
- street-level imagery (SLI) from the open repository of Mapillary,
- OpenStreetMap data on walkable paths, extracted with the ohsome API,
- a repository of elevation data based on a high-resolution Digital Terrain Model (DTM), mirrored from Mapterhorn.
For validation, the authors also created a dataset from low-altitude imagery acquired in an unmanned aerial vehicle (UAV) survey. This imagery was processed into a high-quality RGB orthomosaic, which allowed precise measurement of sidewalk clearance, assignment of surface type, and verification of surface condition.
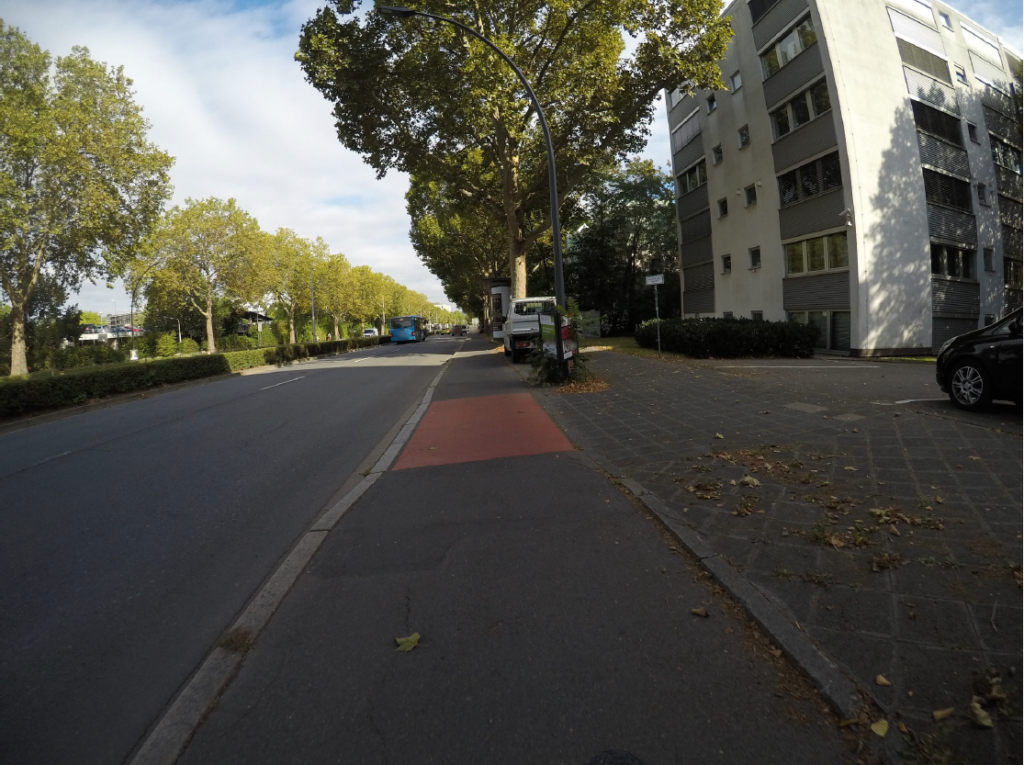
The data processing follows five main steps (the code repositories are openly available):
- Sidewalk segmentation: We determine which pixels in a street-level image belong to pedestrian surfaces.
- Sidewalk width estimation: We estimate how wide the usable path is, in meters, together with an uncertainty value.
- Surface type and condition estimation: We identify the surface type (asphalt, concrete, cobblestone, gravel, tiles, brick, dirt, grass, mixed, or other) and the surface condition (excellent, good, fair, poor, or damaged).
- Slope estimation: We combine walkable paths from OpenStreetMap with the elevation data from the Digital Terrain Model and determine local slope variation along paths.
- Scoring: We combine the sidewalk width, surface type, surface condition, and slope measurements into a Wheelchair Accessibility Index (WHAI). The index is always explainable and customizable to specific needs.
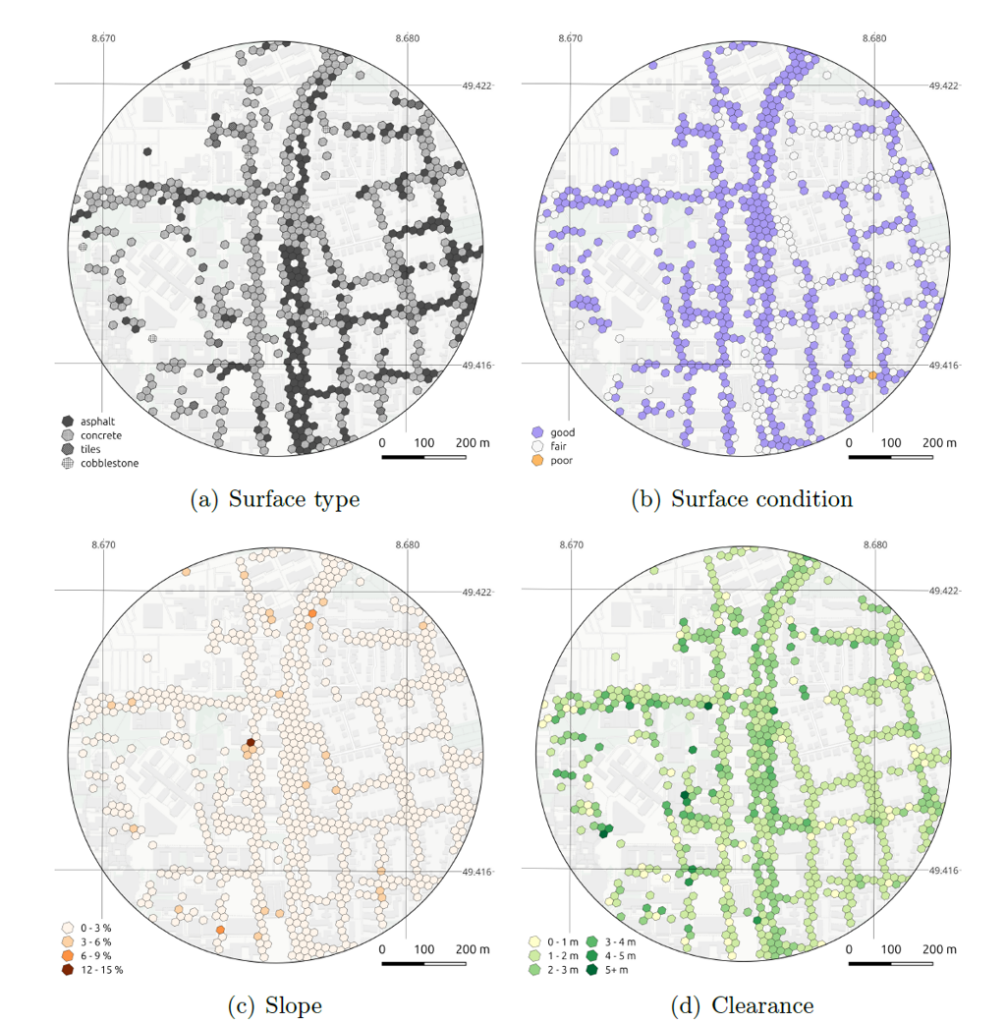
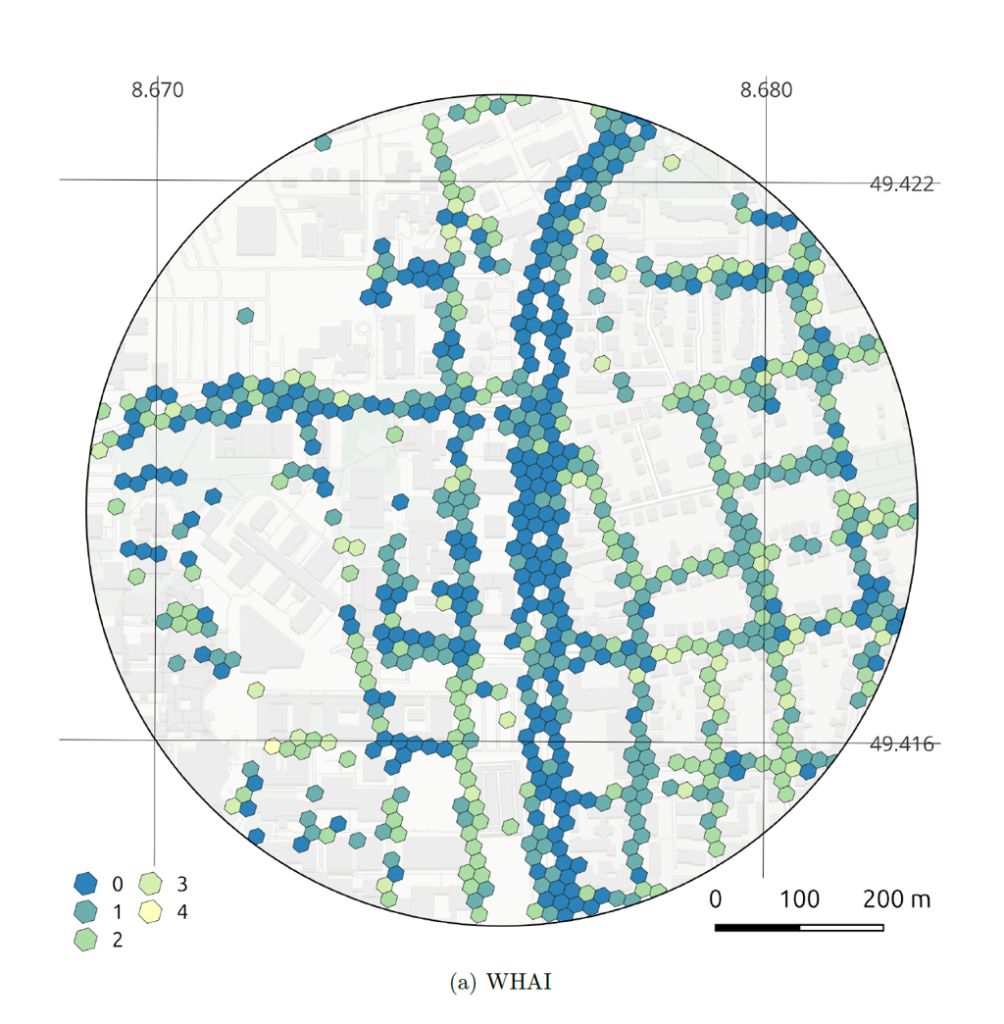
Practical result of Heidelberg: sidewalk properties estimates (Map tiles by CartoDB, under CC BY 3.0; Data by OpenStreetMap, under ODbL)
What the framework can do…
The pipeline was validated against UAV and aerial orthoimagery in areas of varying accessibility in Łódź, Poland, and applied in Heidelberg, Germany, with positive results that demonstrate the reliability and practicality of the pipeline.
The dataset and index can be used by urban planners, researchers and other stakeholders to assess various crucial aspects of wheelchair accessibility with a high resolution and reliable results:
- Track progress and plan investments: The wheelchair accessibility index and database can be used to identify targets for infrastructure investment. The effect of improvements can be verified by recomputing the index after the work is completed, showing whether a barrier is really gone and by how much the area has improved. This allows for recurrent, low-cost monitoring, which lowers the barrier for municipalities to monitor and improve their infrastructure.
- Identify inaccessible areas: The index can reveal localized inaccessible areas that conventional spatial analyses often overlook. It provides an explainable and comparable basis for evidence-based urban planning and for improving pedestrian routing.
- Point to possible exclusion zones: Urban features are spatially autocorrelated. A hilly district tends to be steep across many cells, and a historic quarter tends to have cobblestones throughout. The index will therefore show clusters of cells with poor accessibility. Such a cluster marks an area that is difficult to enter or to leave for a wheelchair user. Above a critical intensity and extent, such a cluster becomes an exclusion zone for unassisted wheelchair users. Knowing where these clusters are also helps to decide where improvements would make the biggest difference.
- Scale with less survey effort: Wheelchair accessibility is assessed with quantitative parameters, which makes the assessment easily scalable and verifiable, complementing interviews and the lived experience of wheelchair users.
- Use other data sources: The pipeline is not bound to specific imagery or elevation repositories, making it possible to integrate alternative data sources.
- Be reused and audited: The code is openly available and prepared to accept auditing, feature requests, and improvements.
… and what it cannot do
The methods and source data used currently present some limitations, some of which are a trade-off for using only open data and methods:
- Missing infrastructure components: Some important pedestrian infrastructure components such as crossings, stairs, cross slope, curbs, and curb cuts are not included in the index. Dynamic factors such as snow and sidewalk crowdedness, and user profiles such as health condition and confidence level, are also outside the scope.
- Slope errors: The used Digital Terrain Model excludes the elevation of man-made structures such as bridges, footbridges, and tunnels. Slopes around these structures are therefore overestimated.
- Compounding model errors: Several deep learning and machine learning models run in sequence, with the output of one serving as the input of the next, so errors tend to compound. This is mainly solved by stochastic models that add noise to the overall output.
- Dependence on Mapillary coverage: We chose open, crowdsourced imagery for transparency and transferability. The price is uneven coverage: Mapillary depends on volunteer contributions, so consistent spatial and temporal coverage cannot be guaranteed. At the same time, this allows users who want to compute the index for an area to collect their own street-level imagery and upload it themselves.
- Computation: The pipeline relies on a sequence of specialized deep learning models that require considerable processing capacity. City-scale processing would require intensive model quantization, distributed multi-GPU deployment, and swapping the general approach to fine-tuned specialized models,
Next steps
After publishing this first version of the pipeline, we plan to keep working on developing the framework.
We aim at improving accuracy by refining the segmentation models at the pipeline’s entry point. Moreover, we can increase throughput and scalability by retraining and distilling the feature extraction models. Coverage can be broadened by integrating additional street-level imagery sources such as Panoramax, and joining the results with routing services would help improve accessible routing. Taking into consideration infrastructure such as stairs, bridges and tunnels wold make WHAI even more comprehensive.
Finally, it is possible to combine the index with population data and show how many people live in or near areas with low accessibility. This is particularly relevant because being exposed to a barrier and being vulnerable to it are not the same thing.
To make sure the index is useful in practice, we would like to test how it is understood and used together with municipalities and wheelchair user organizations. We welcome feedback, project contributions and potential uses cases at climate-action-navigator@heigit.org.
Reference:
Maciej Adamiak, Gefei Kong, Danielle Gatland, Andrzej K. Oleś, Kirsten von Elverfeldt, Alexander Zipf, Sascha Fendrich (2027). From street-level imagery to actionable mobility metrics: A deep learning framework for computing wheelchair accessibility from pedestrian sidewalk infrastructure features. Computers, Environment and Urban Systems, Volume 132. https://doi.org/10.1016/j.compenvurbsys.2026.102553.