Claudio Sossio De Simone is a PhD candidate at the University of Rome Tor Vergata in the field of Cultural Heritage, Education and Territory. His research interests include GIS science and geoinformation applied to cultural heritage, as well as the geo-historical study of rural landscapes.
The Sketch Map Tool was used as part of his PhD research on the changing territory around an artificial dam in a rural area in southern Italy. The research aimed to identify significant landmarks and prove decision-makers with geographical data to develop cultural, environmental, and touristic initiatives [1].
The project
The study area is a rural region between Molise and Apulia in Southern Italy that is mostly mountainous and only sparsely populated. In the late 1950s, an artificial dam was built in this area to form the Lake Occhito. The area is included in the protected areas of the Natura 2000 network [2], with the vegetation surrounding the lake providing habitats for several protected species. However, the dam has altered the local environment. The instability of the new waterscape has caused frequent flooding. In addition, the agricultural system has been profoundly changed and the local traditional pastoral activities have almost completely disappeared. This changing scenario, along the ongoing efforts by stakeholders and communities to develop a new governance plan, underscores the need for enhanced spatial knowledge of the area by combining institutional data with the local community expertise.
Why was the Sketch Map Tool used?
The Sketch Map Tool was used as a means to capture the local perception of the area around the Occhito dam by identifying environmentally, culturally or socially significant landmarks as perceived by the local community. This tool was chosen because it effectively captures the community’s perspective on the territory and facilitates the processing and digitalization of offline spatial knowledge.
How was the Sketch Mapping organized?
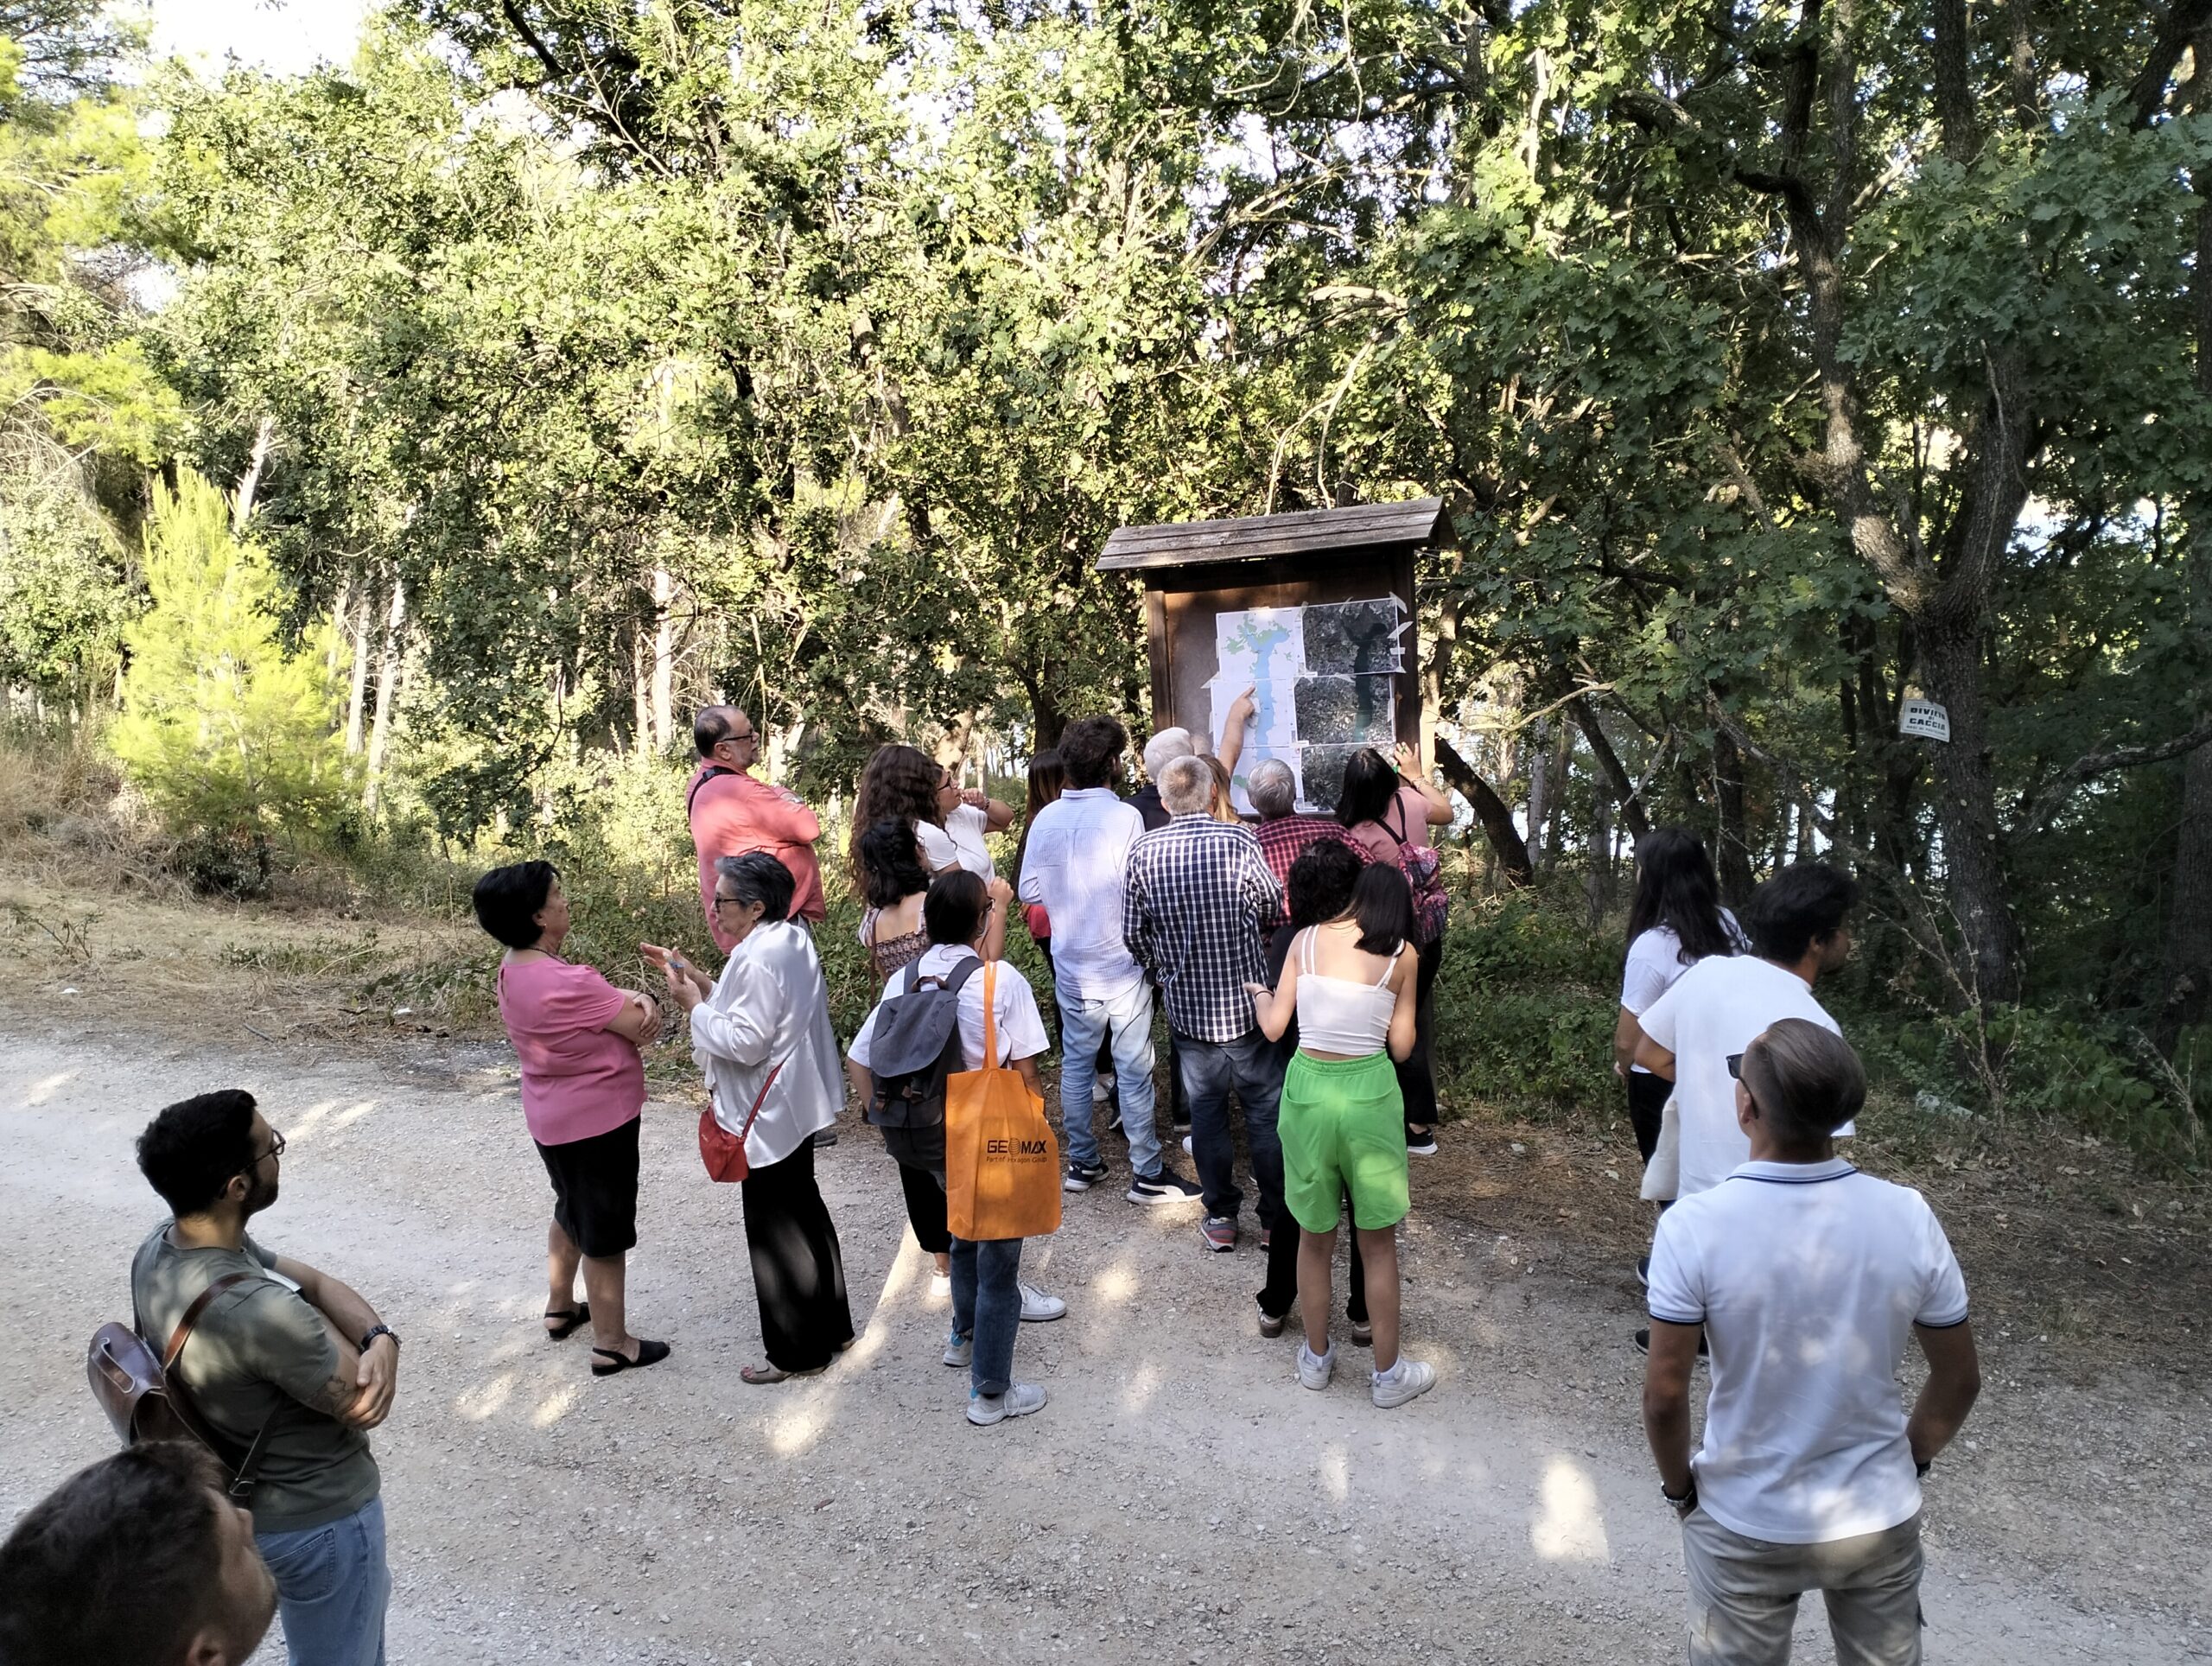
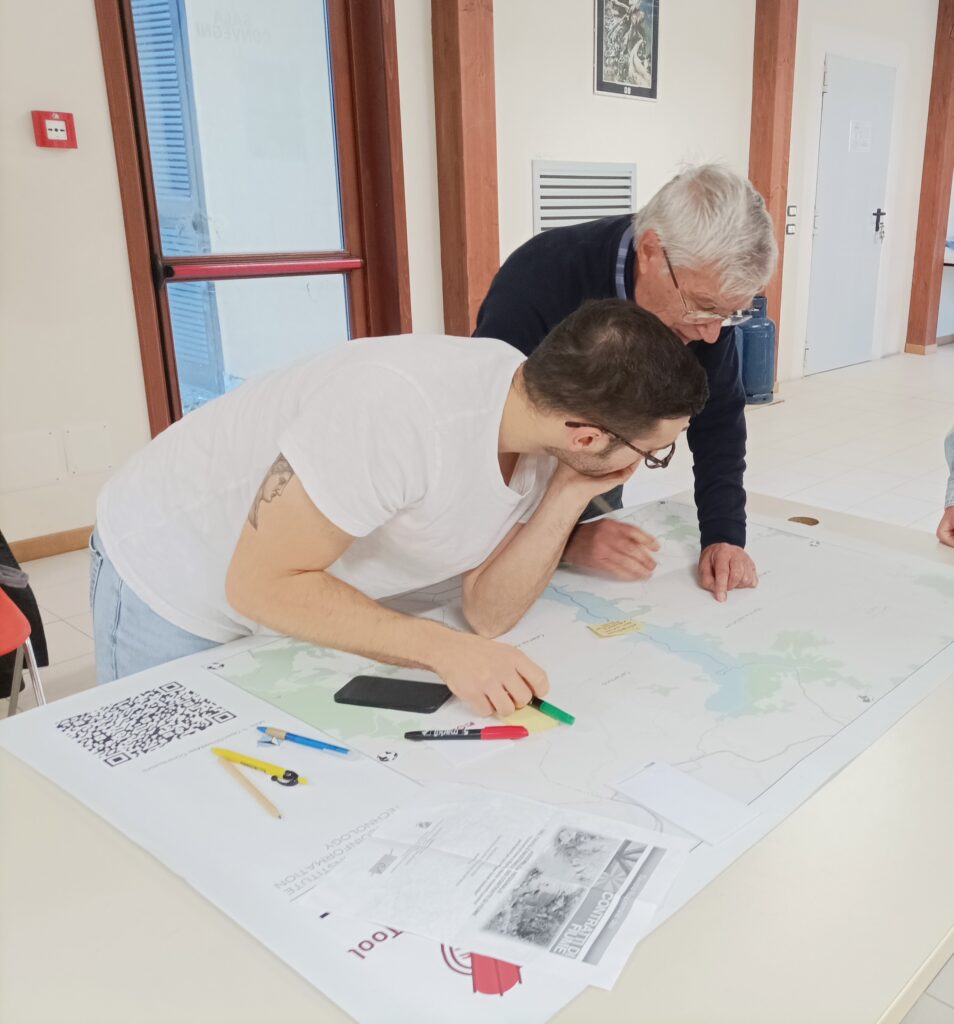
Community mapping was conducted with both adults and schoolchildren aged 11 to 14, who were instructed to jointly work on Sketch Maps in small groups. The participants were local volunteers that live in the area near the Occhito dam. The mapping session with A3 (large scale) and A0 (small scale) Sketch Maps took place on the field as well as in the classroom.
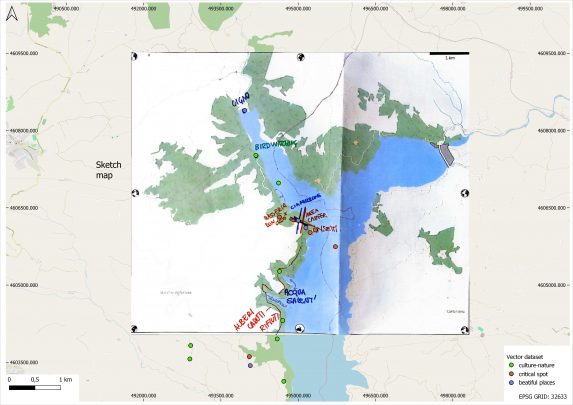
Participants could draw landmarks and identify them as “cultural-natural places” (e.g. monuments, archaeological sites, birdwatching sites), “problematic places” (e.g. areas littered with garbage, flood-prone areas), and “special places” with a strong subjective value (e. g. a place for picnicking with family, the spot where the mapper kissed for the first time) [3].
How were the Sketch Maps analyzed?
As a first step, the geodata from the digitalized Sketch Maps was manually cleaned, corrected and enhanced.
Then, the collected markings of landmarks were uploaded to the Google My Maps platform for a quicker and better visualization of the collected data during the mapping session in the classroom.
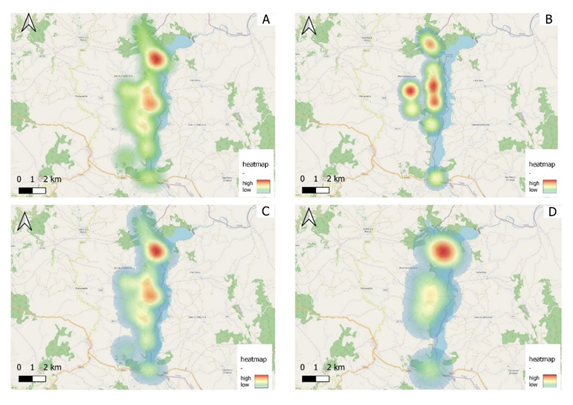
As a further step, the Heatmap Plugin in QGIS was used to perform a density analysis on the point layers, resulting in heatmaps that visualize the intensity of a phenomenon in an area based on the density of points. Multiple heatmaps were created to map the density areas of the selected landmarks, which can later be used to analyze the cultural and social aspects of the area [4].
Results & Impact
The VGI data collected with the Sketch Map Tool sessions is to be merged with institutional data (e. g. land use maps, census data, maps of cultural sites) into a GIS platform, creating a web map that can be used to develop new cultural and touristic initiatives as well as a better governance of the problematic areas.
Lessons learnt
- Demographically varied target groups deliver different mapping results, especially when mapping subjectively relevant landmarks. Adult mappers demonstrated greater skills in orienting themselves on the map and geolocating landmarks, while the younger participants had more difficulties in orienting themselves in space, but identified more unconventional, subjectively relevant landmarks, showing interest on different areas and characteristics of the landscape.
- Community mapping clearly showed its potential to highlight some aspects of the local resources and landmarks that are not present in the official cartography, particularly in regard to places with a cultural or subjective value.
- Many community mappers can orientate themselves more easily on a satellite map than on the OSM base maps. Since the Sketch Map Tool 1.0 was used, which only supported OSM as base map, satellite maps were used along OSM-based Sketch Maps to help with the orientation. Sketch Map Tool 2.0. now allows to integrate satellite imagery directly in the base maps.
We look forward to hearing about more use cases and diverse applications of the Sketch Map Tool. For updates and case studies, you can subscribe to the Sketch Map Tool Newsletter. If you have any questions or encounter any issues, please visit our help-page and contact us via Mail sketch-map-tool@heigit.org.
Sources
[1] https://www.openstarts.units.it/entities/publication/9a2bdb36-9f29-43b9-8c6e-fc8d8c27fce3/details
[2] https://biodiversity.europa.eu/sites/natura2000/IT7222248
[3] In establishing the categories of landmarks considered, reference is being made to what has been proposed in the literature regarding the definition of landscape services by the Millennium Ecosystem Assessment, available at https://www.millenniumassessment.org/en/index.html