This blog article was originally posted on Medium by Maciej Adamiak, machine learning expert at HeiGIT.
It’s very easy to take many things around us for granted, especially when you live in a big city. Particularly, the web of infrastructure that keeps people connected quickly fades into the background during our daily activities. Of course, public transport, sidewalks, bike lanes, and many other amenities that make our lives easier didn’t appear out of thin air. We are simply used to them, so we don’t focus much on their features.
I frequently catch myself on some kind of organic autopilot when travelling to familiar locations. You probably know the feeling when you leave your home and teleport to your office, barely registering what happened on the path you have been walking on continuously for a couple of years. Normal stuff you would say.
That’s true, but only when you are healthy enough to treat the components and the dimension of your path as a facilitation, not an obstacle. Older adults, young children, and people with disabilities may have different perspectives. Even though it’s just as simple as having to deal with a too-narrow sidewalk to travel to school safely, the grocery store, or the pharmacy.
Fortunately, my primary work goal is to understand diverse spatial perspectives and explore how they can be expressed through machine learning. During one of the iterations of HeiGITs‘ marketplace (you can read more about how we work in our blog), I learned more about daily routines and obstacles, and perhaps began building something that could, at least to some extent, help equalise opportunities.
Grab some coffee and let me tell you how I built the one-shot surface estimator — code name HeiMeterStick.
The goal
Before diving into the underlying technology, let’s first describe the idea and the task. Assume we want to calculate the best possible path for a pedestrian with specific sidewalk width requirements to avoid places where movement is difficult or impossible. Anyone who has pushed a ridiculously heavy stroller with a toddler inside understands it immediately. To accomplish this, we would need not only to determine the sidewalk dimensions but also to delineate the sidewalk using available data sources.
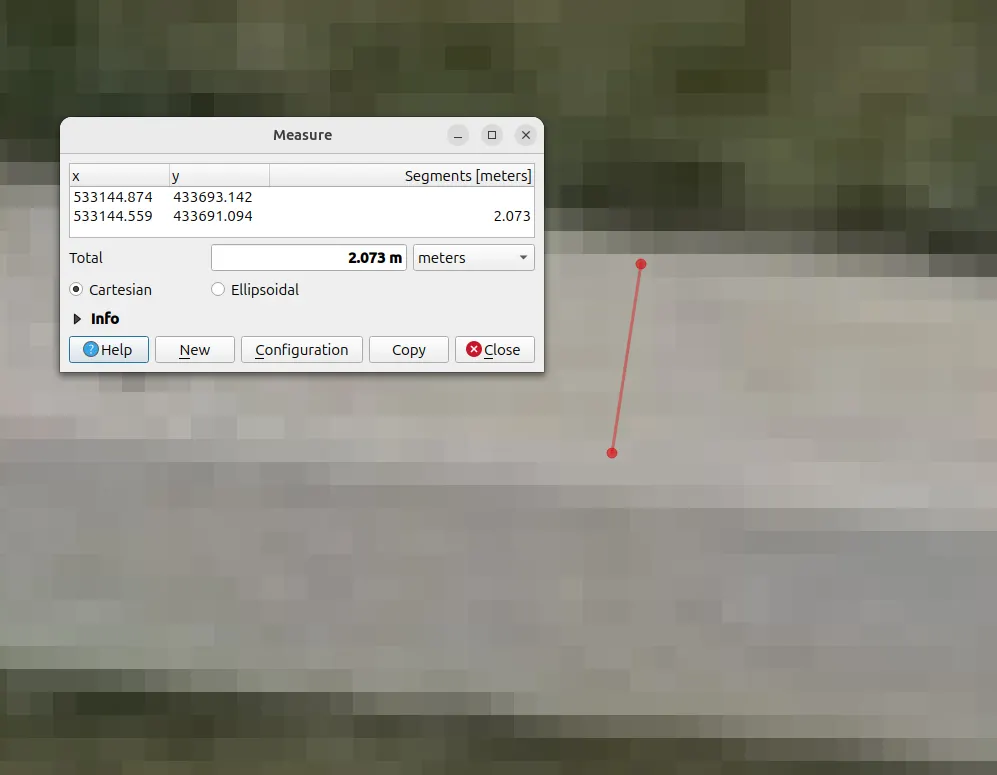
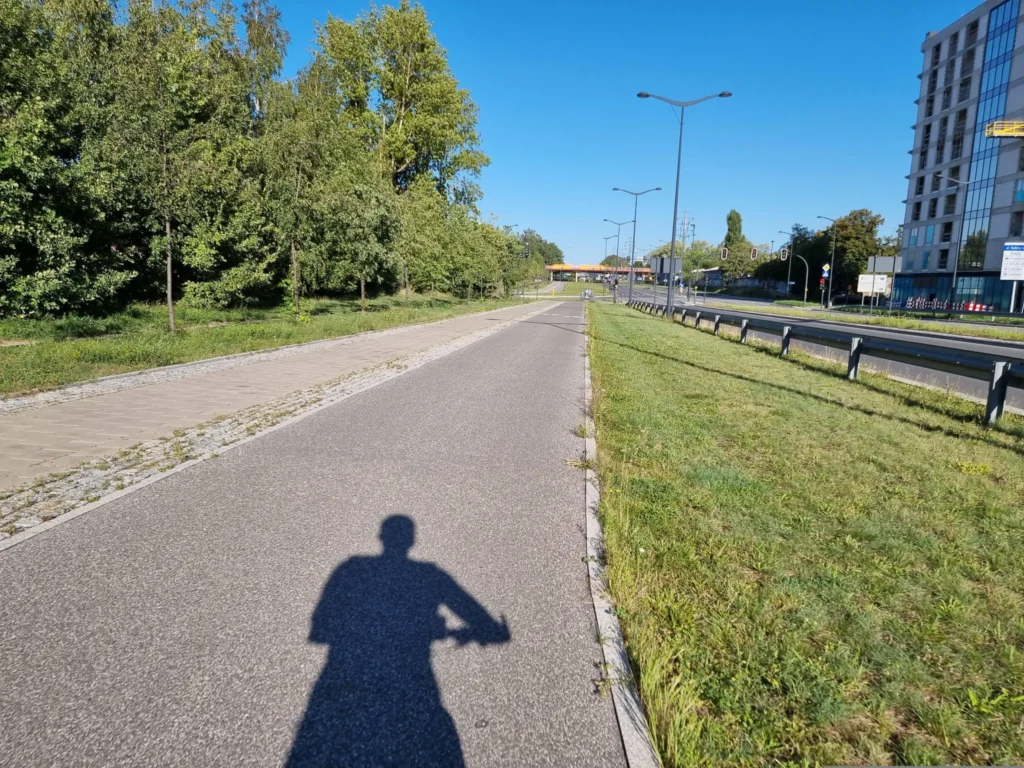
Look at the images below. One is an ortophoto of my hometown Łódź. The other is a street-level image from Mapillary. You can see how one can precisely measure a sidewalk using standard GIS practices. The task could also be fully automated by applying well-known deep learning techniques, such as semantic segmentation. The problem is that not all locations worldwide have high-resolution remote-sensing imagery available, making the proposed solution difficult to apply.
Fortunately, street-view imagery is becoming increasingly accessible. I wrote a blog post about how Panoramax and Mapillary are improving citizen science by providing unrestricted, free-of-charge access to valuable eye-level imagery. As you will see in a minute, data accessibility comes at the cost of the solution’s complexity. Measuring objects from single-shot imagery is not easy.
Context has been set — now let’s define the technical goals:
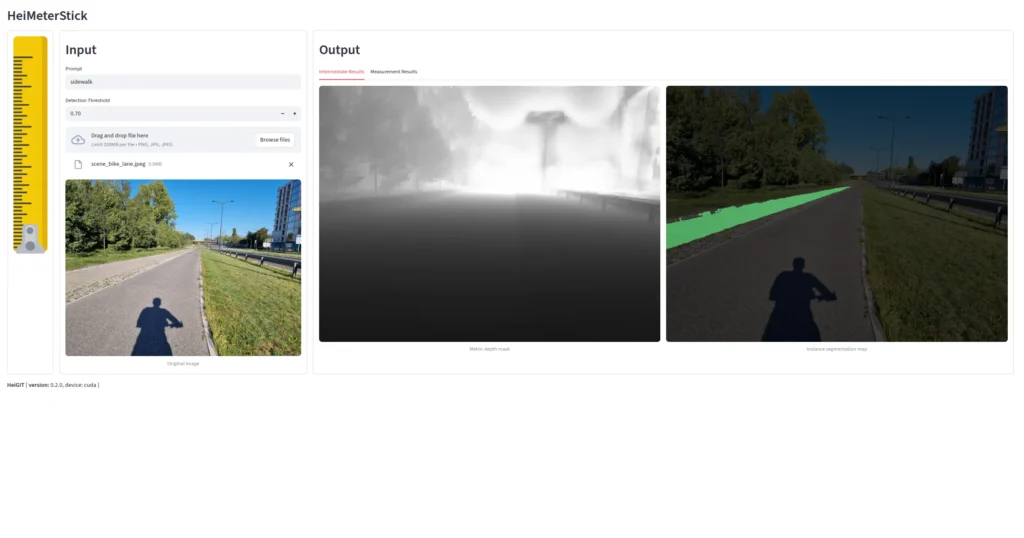
- Build a computer vision tool that measures horizontal surfaces (sidewalks, floors, etc.) in street-view imagery from sources such as mobile phones, Mapillary or Panoramax. The minimum viable product (MVP) is to estimate surface clearance (width), but the architecture should support extending to other measurements. No constraints on data modalities or algorithms — whatever gets results fastest. Prioritise open-source, state-of-the-art models that run on a single development laptop without high-performance computing (HPC) resources. Fail fast on anything that’s computationally expensive or overly complex during the proof-of-concept (PoC) phase.
- Provide both a CLI and a UI so you can demo visually without diving into technical details. The implementation should be as general as possible to allow easy extension to new measurements or surface types. Keep the code clean and modular — this is about rapid prototyping with quality foundations, not a rushed mess. Experiment with multiple approaches, learn from what doesn’t work, and enjoy the process.
The method
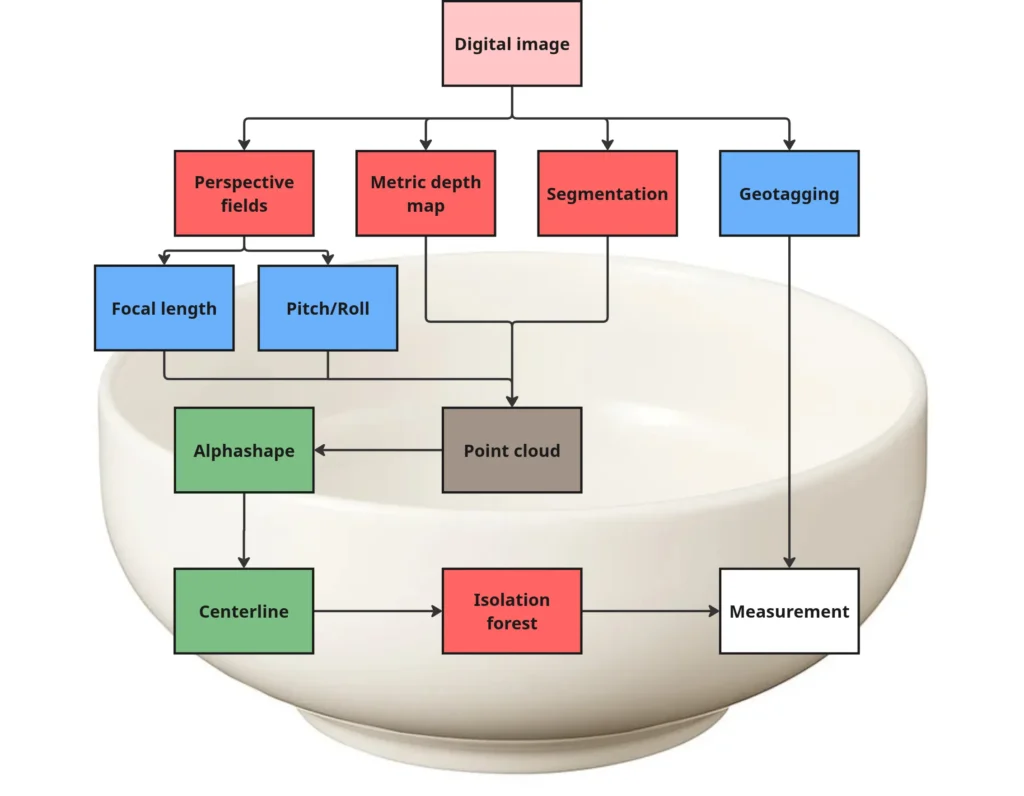
Going from a single image to estimating an arbitrary surface width is a multistep process that combines computer vision, geospatial analysis, and machine learning techniques. All the ingredients already exist and are the state-of-the-art result of research carried out by many recognised institutes and companies. My humble task was to mix them.
Phase I – Image Preprocessing and Feature Extraction
A. Image loading and normalisation — load the input image and convert to RGB format to ensure consistent colour channels for downstream models. I prefer using Pillow for such tasks because it integrates seamlessly into complex data processing pipelines.
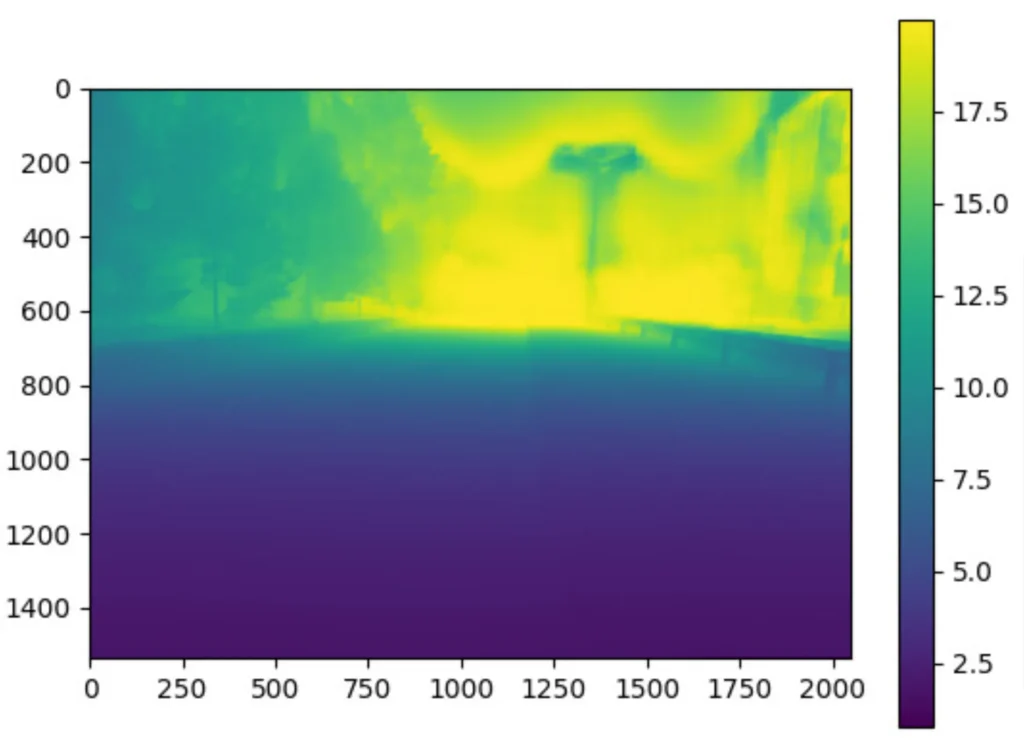
B. Monocular depth estimation — apply a deep learning depth estimator (DepthAnything) to generate a dense metric depth map. It predicts, in meters, the distance from the camera to each pixel in the image, thereby recovering the 3D structure from a single 2D photo. The quality of this step is crucial because it directly affects the estimate of dimensions.
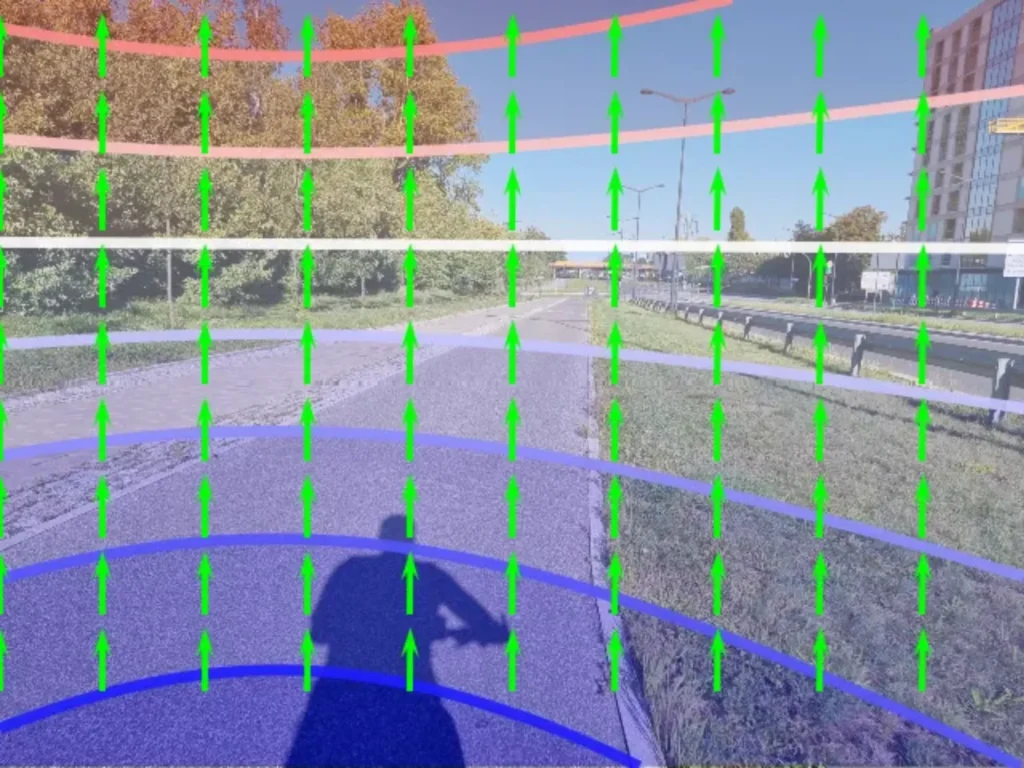
C. Camera calibration and perspective fields — extract from EXIF metadata, if not available, estimate using GeoCalib the camera intrinsic parameters (focal length, principal point) and extrinsic parameters (camera orientation, tilt angle). This step is essential for accurate deprojection from 2D pixel coordinates to 3D world coordinates. Moreover, GeoCalib performs well on distorted and cropped images.
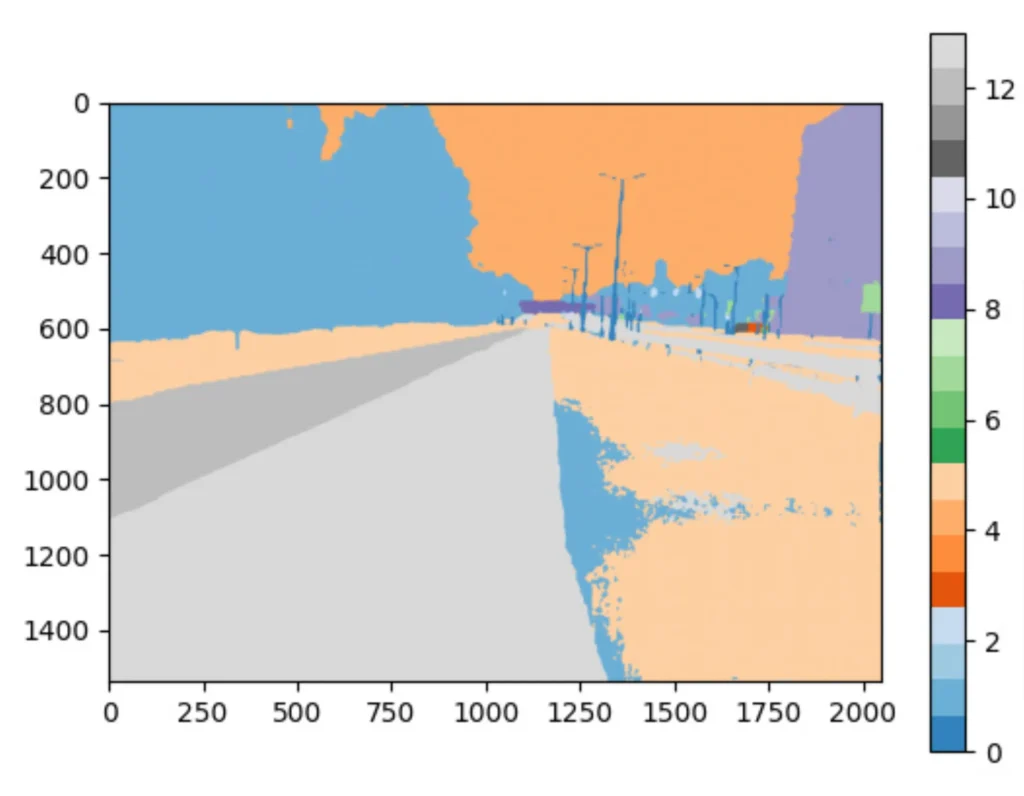
D. Object detection and semantic segmentation — run a prompt-driven vision model (SAM3) to identify and segment objects matching the provided text prompts, e.g., sidewalk, pedestrian path, or walkway. Each detected object is assigned to a binary mask indicating which pixels belong to it, along with a confidence score. Using text prompts is useful because it allows the model to adapt to different spatial contexts by adjusting the prompt or making it more specific.
E. Resolve geospatial coordinates — attempt to extract GPS coordinates from EXIF metadata if the image comes from geotagged sources like Mapillary or Panoramax. This allows the measurements to be georeferenced and integrated into spatial databases or routing applications.
Phase II: 3D Point Cloud Reconstruction
Classified point cloud generation — this is where 2D becomes 3D. For each pixel in the image:
- Use the depth map to get the distance from the camera.
- Use the calibration metadata to deproject the pixel’s 2D coordinates into 3D space.
- Label the point with its object class from the segmentation masks.
The result is a 3D point cloud where every point knows its spatial position (X-width, Y-height, Z-depth) and which object it belongs to (CLS). This effectively creates a sparse 3D reconstruction of the scene from which we can extract only interesting surfaces.
Phase III: Individual Surface Measurement
A. Point cloud sectioning — extract only the subset of 3D points that belong to the analysed surface, filtered by a class index. This isolates the specific object to be measured from the rest of the scene. Here we also heavily postprocess the point cloud by simplifying it and removing outlying points.
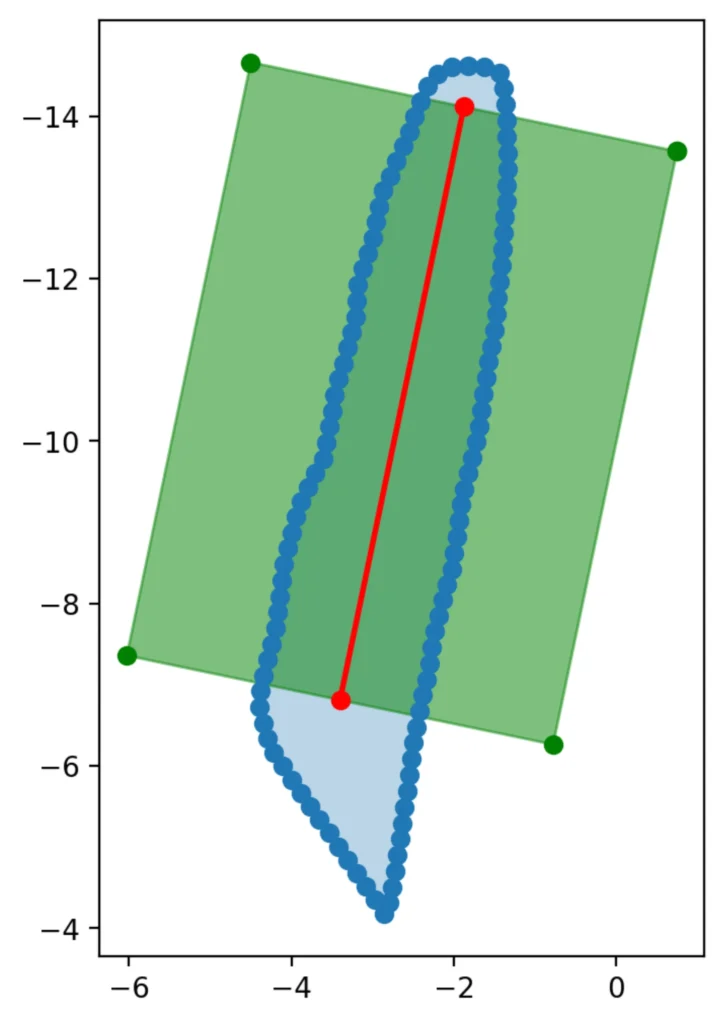
B. Spatial projection and geometric analysis — Project the 3D points onto the XZ plane (ground plane, assuming Y is vertical). Then compute some helpful geometries and distances:
- Alphashape: The concave hull that contains all projected points, representing the outer boundary of the surface. Here, we use our own heuristic algorithm rather than the classical AlphaShape library to accelerate the process.
- Corridor polygon: A simplified, walkable representation of the surface area. Created by simple polygon operations.
- Centerline: A path running through the middle of the surface, representing the optimal walking trajectory.
- Perpendicular distances: At multiple points along the centerline, measure the perpendicular distance to the hull boundaries on both sides. These distances represent the local width of the surface.
C. Statistical clearance metrics — From the array of perpendicular distance measurements:
- Mean clearance: Average width of the surface, with an Isolation Forestoutlier removal using the contamination parameter (default 5% of extreme values filtered out). This makes the estimation more robust to segmentation errors.
- Standard deviation: Quantifies width variability — low values indicate consistent width, high values suggest bottlenecks or irregular shapes.
D. Quality assessment — Evaluate measurement reliability based on geometric properties. The quality score helps filter unreliable measurements or flag surfaces that need manual review. This considers factors like:
- How well-defined the hull is (sparse vs. dense point coverage).
- How straight or curved the centerline is (complex paths may have less reliable measurements).
- Aspect ratio of the surface (very elongated or irregular shapes may be problematic).
- Point cloud density and distribution.
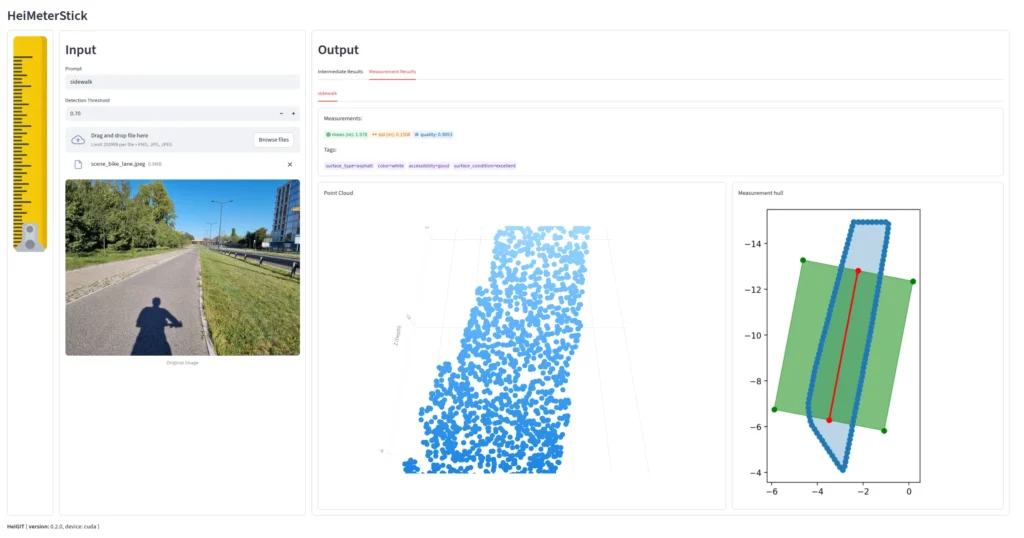
E. Final Output — Each detected surface is associated with a data collection that includes the segmentation mask, 3D point cloud, geometric shapes (hull, corridor, centerline), and the key measurement: clearance_mean ± clearance_std in meters, representing the estimated width and its uncertainty.
Trial run
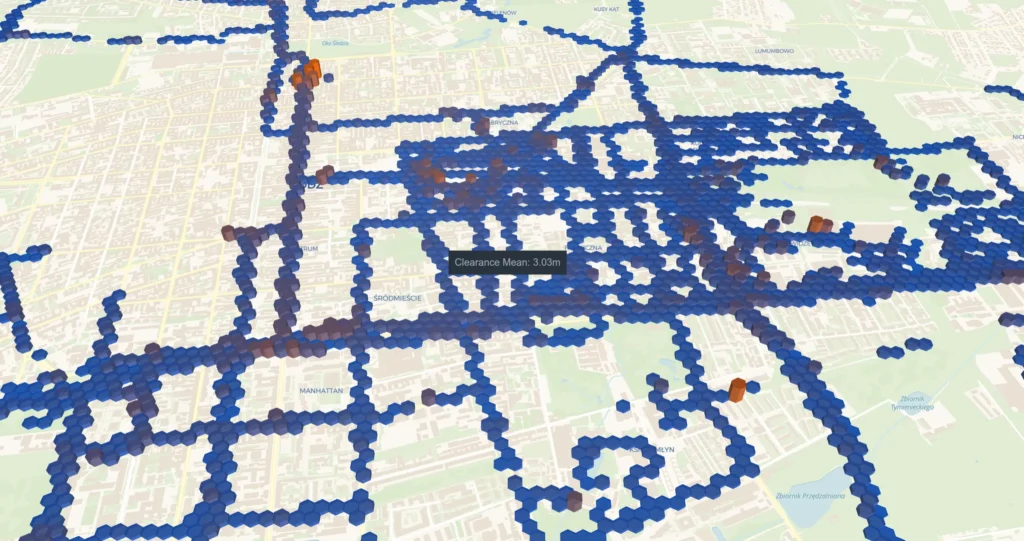
What would spatial analysis be like if it weren’t for trying to run the algorithm over a larger area? Let’s try it with the centre of Łódź.
In the image below, you can see the HeiMeterStick pipeline run on 80k images acquired from Mapillary. The output has some anomalies, but overall it’s very promising.
What’s next
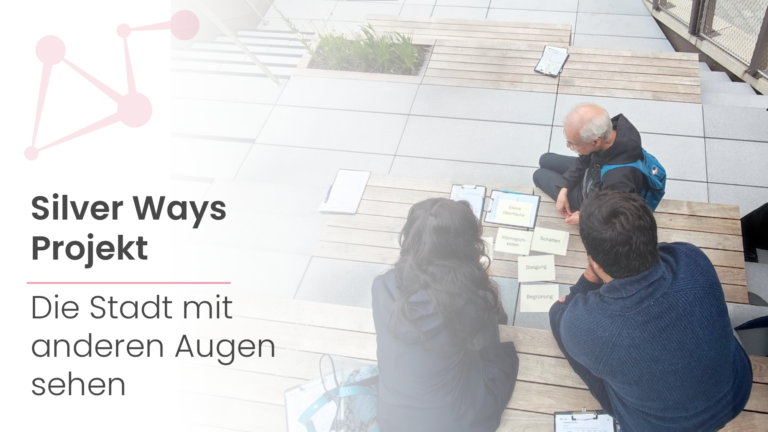
The measurement pipeline is still being refined and tested across larger geographical areas. The goal is to build a comprehensive dataset of surface measurements across different countries and conditions. It could significantly contribute to our initiatives in climate action (CAN) and the SilverWays project. It’s a long road ahead, but we’ll see where it takes us.
If you’re working on applications for humanitarian response, have a use case where crowdsourced geospatial intelligence could make a difference, or just want to see more results, we’d like to hear about it! Our team at HeiGIT(Heidelberg Institute for Geoinformation Technology) collaborates with NGOs and humanitarian organisations to develop and deploy these technologies in operational contexts. Contact info@heigit.org to discuss potential collaborations or technical implementations.