Can OpenStreetMap data serve as a foundation for routing? In practice, the answer already seems to be yes: a growing number of applications, services, and organizations rely on OSM data every day, and if the results were consistently poor, they would not continue to do so. Yet concerns about data quality in underrepresented regions and about routing reliability relative to commercial alternatives such as Google Maps remain difficult to resolve universally. Intuition is not the same as evidence, and that is what this study sets out to provide.
To move the discussion onto empirical ground, HeiGIT and the Federal Agency for Cartography and Geodesy (BKG) joined forces to investigate how OSM data quality affects routing outcomes. Their study examines three dimensions of data quality (completeness, attribute accuracy, and timeliness) and asks how each dimension shapes the routes produced by services like openrouteservice (ORS).
To establish a baseline for comparison, thirty city-to-city routes were computed across several countries and benchmarked against Google Maps, Bing, Apple Maps, and Graphhopper along two parameters: distance and travel time. The course of the route itself was not taken into account, as it constitutes a qualitative parameter that would considerably complicate the comparison.
On average, ORS produced shorter travel time estimates than both Google Maps and other open-source alternatives. For routes generated in France, Japan, Mali, and Pakistan, ORS was usually slightly faster by 2-5% of the entire travel time. The most pronounced discrepancies, however, emerged in India and the Democratic Republic of Congo, which will be examined in detail below.
India: a speed attribute problem
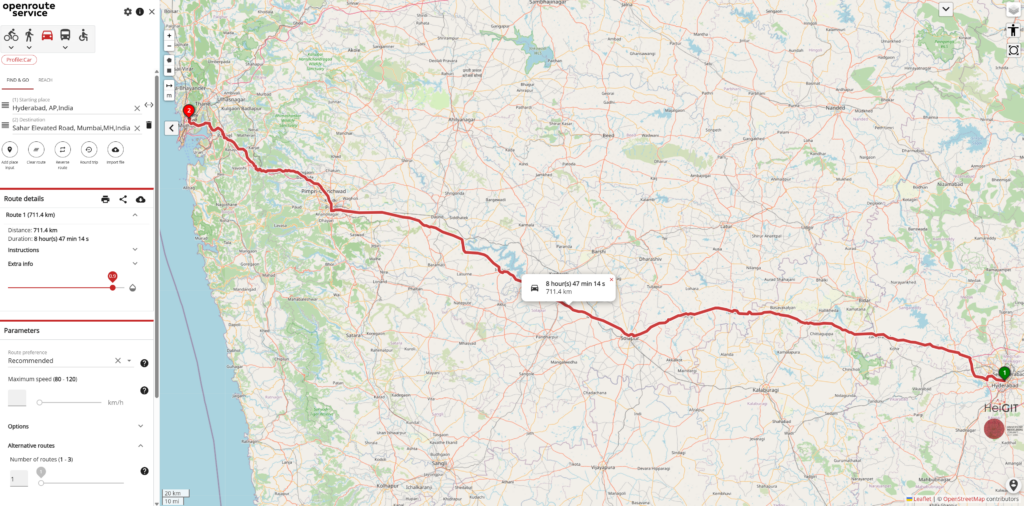
In India, the route from Hyderabad to Mumbai computed by ORS estimated a driving time of 8 hours 47 minutes over a distance of 711 km. The road in question is paved and designated as a two-lane national highway, making it a relatively straightforward corridor. Yet Google Maps estimates nearly 14 hours for the same journey, while Apple Maps and Bing Maps place it between 11 and 12 hours. GraphHopper—another open-source routing engine—produced the longest estimate of all, exceeding 14 hours. The explanation lies in the interaction between data quality and routing engine assumptions. Both GraphHopper and ORS rely on the same underlying OSM data, yet they arrive at substantially different estimates because each engine applies its own default speeds when the maximum speed attribute is missing or invalid. Where ORS assumes a higher default, GraphHopper falls back on approximately 65 km/h.
Democratic Republic of Congo: a current problem
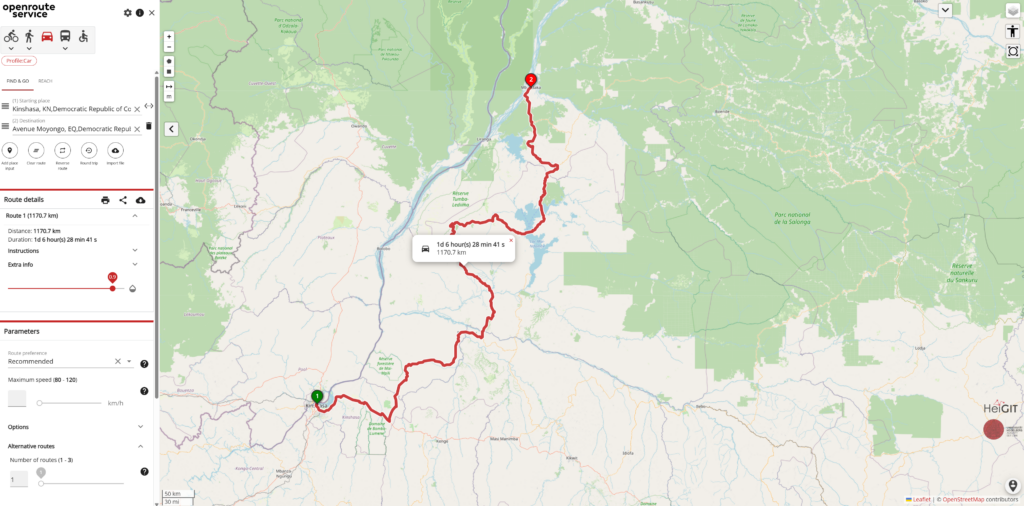
The route from Kinshasa to Mbandaka stretches approximately 1,170 km and is considerably more complex, involving several ferry crossings along the way. For the same origin and destination, Google Maps suggests an entirely different route of around 2,747 km requiring two days of driving. Bing Maps offers both options, while Apple Maps cannot calculate a route because it avoids all ferry connections. The presence of multiple ferry connections is likely a key factor behind these divergences, but the bigger issue is how current that ferry data actually is.
Data quality analysis with the ohsome dashboard
To analyze these discrepancies systematically, the study draws on the ohsome dashboard, a tool that offers a set of OSM quality indicators which can be examined individually and tracked across different points in time.
The workflow is relatively simple: users select a region of interest, choose a quality indicator, and combine it with a specific data layer. The result is an overview of OSM data and metadata statistics, assessed across dimensions such as mapping saturation, currentness, attribute completeness, land-cover completeness, and user activity.
Applying this framework to the Hyderabad–Mumbai route shows that the completeness of the maximum speed attribute along that corridor stands at just 1.9%, compared to approximately 43% for Germany as a whole. It is worth noting that 100% attribute completeness is rarely achieved anywhere. Attributes such as maximum speed and road type directly influence how a routing engine interprets a given segment, and both their presence and accuracy vary considerably across national and local contexts. When data is missing or ambiguous, routing engines must fall back on default assumptions, with consequences that can amount to hours‘ difference in estimated travel time.
The Kinshasa–Mbandaka route illustrates a different pattern, where data currentness becomes the critical variable. Ferry schedules, in particular, have an outsized impact on estimated travel times, yet ferry information along this corridor was last updated six years ago. Outdated data introduces a subtler problem than simple incompleteness. A routing engine will incorporate ferry connections that may no longer be operational, producing routes that appear plausible but cannot be relied upon in practice.
Taken together, the case studies point to three factors that shape routing quality in OSM-based engines: data availability, meaning whether relevant features such as ferry connections are mapped at all; currentness, meaning how recently that data was verified or updated; and route centrality, reflecting the structural importance of a given road within the transportation network. These factors do not operate in isolation, and their relative importance varies by region and infrastructure type.
Conclusions
OSM-based routing engines are well optimized for Germany and much of Europe, but applying them globally requires careful attention to local data conditions. Across all 250 routes generated on the basis of OSM data, a route was always found. OSM is, in that sense, a viable foundation for routing worldwide. However, critical regions exist where data gaps and outdated attributes can significantly distort results, and this is precisely where tools like the ohsome dashboard allow practitioners to assess data quality.
The reliability of OSM ultimately depends on the community that sustains it. Every contribution directly shapes the quality of the routes that millions of people and applications depend on. The more actively the mapping community engages with underrepresented regions, the more reliable OSM becomes as a foundation for global routing.
For those looking to assess data quality in their own region, the ohsome dashboard can compute quality indicators for any area of interest, showing where contributions are most needed.
The full talk is available at: OpenStreetMap-Daten als Grundlage für Routing – wie gut funktioniert das wirklich?