Data from OpenStreetMap is essential for humanitarian organizations. However, it only reaches its full value when it reflects reality on the ground. This applies to many aspects, from the state of road infrastructure to the completeness of building data or the distribution of healthcare facilities.
This is where the idea of OQAPI country reports comes in, providing an overview of whether OSM data in a country or region is fit for purpose.
Data quality on HDX
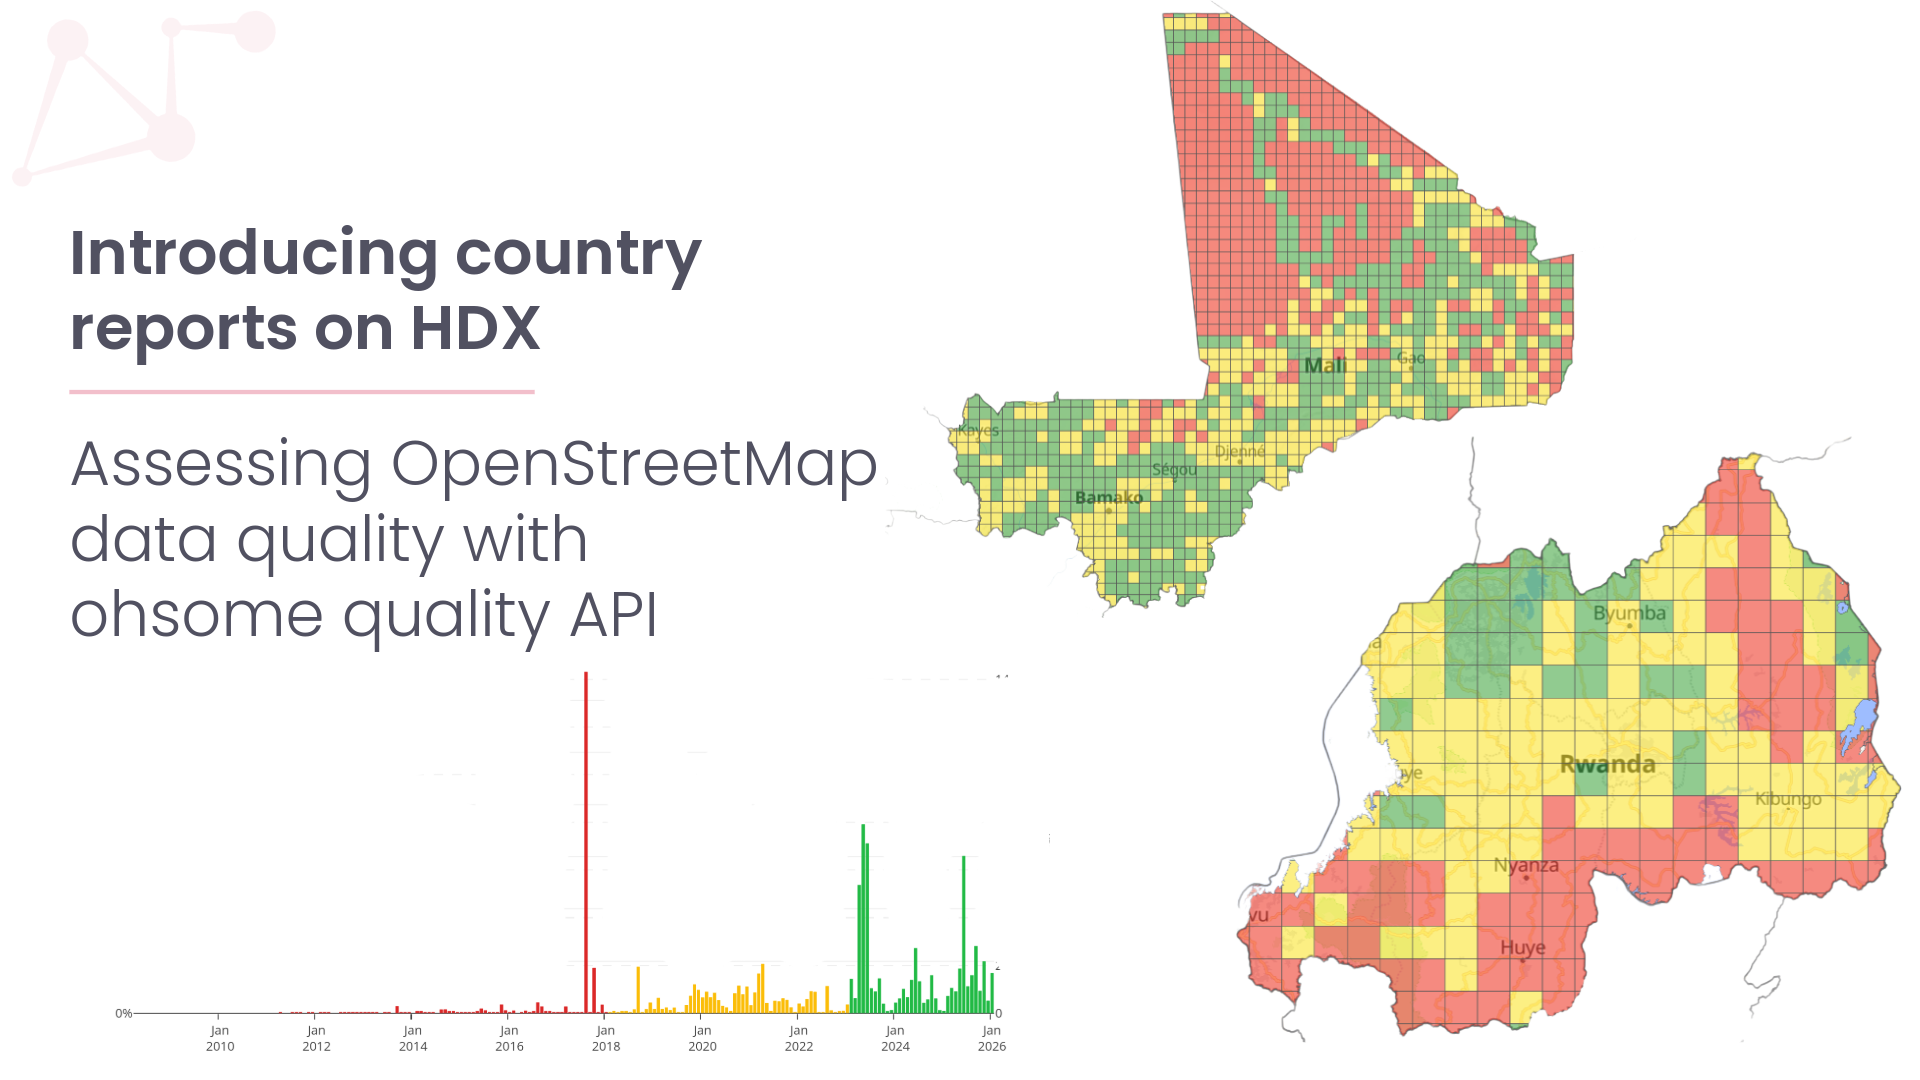
These reports are now also directly available on the Humanitarian Data Exchange (HDX) platform. Whenever users download one of our datasets, they will see an interactive report summarizing key OSM indicators aggregated in grid cells.
Users can focus on a specific topic of interest and explore how information is distributed across a country. They can compare the availability of data, how up-to-date it is, and how evenly it is mapped spatially. We want to help users quickly understand how well OSM represents the country they are working with.
The results are available as concise country reports integrated into the HDX platform and spatial datasets in formats such as CSV and GPKG, and they are provided at different aggregation levels including 0.1 degree grids, hexagons, and admin1 regions. The reports are updated at regular intervals, currently around every three months, and provide a consistent snapshot of data quality at a glance.
At the moment, the reports focus on widely mapped topics such as roads and buildings. In the future, we plan to expand the reports to include areas such as health and education.
Where the idea came from
The idea of country reports on OpenStreetMap data quality first emerged in 2024, when HeiGIT and the Humanitarian OpenStreetMap Team (HOT) decided to join forces and combine HeiGIT’s surface prediction with HOT’s OSM road exports. The goal was to provide advanced statistics on the Humanitarian Data Exchange (HDX) platform, offering users deeper insight into the underlying data.
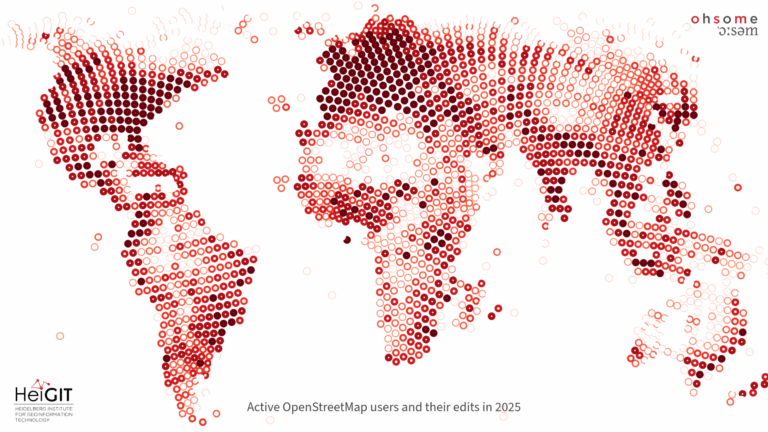
Since all of our datasets rely, to some extent, on OSM as a base layer, it is in our own interest to understand whether the underlying OSM data reflects reality on the ground. We regularly build analyses with and around OSM data, and with this effort, we want to give something back to the community of researchers and mappers. Because when we know where the gaps are, we can act on them.
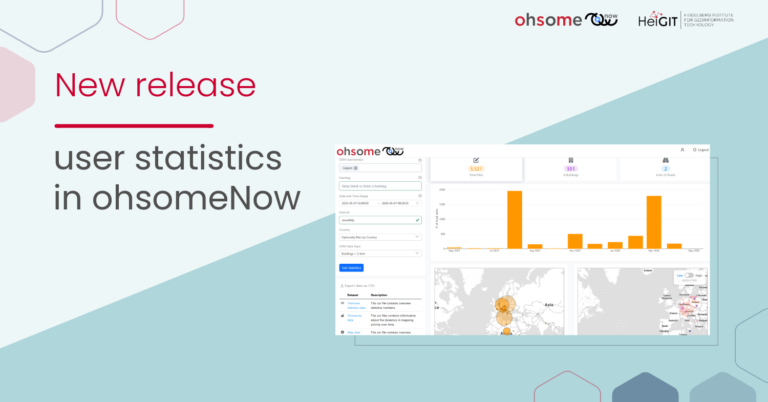
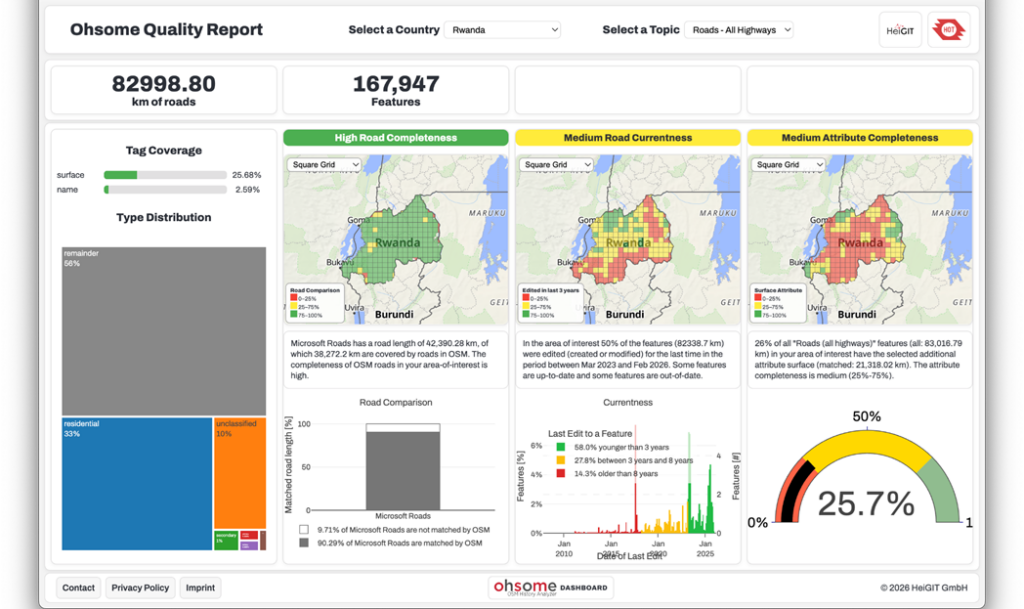
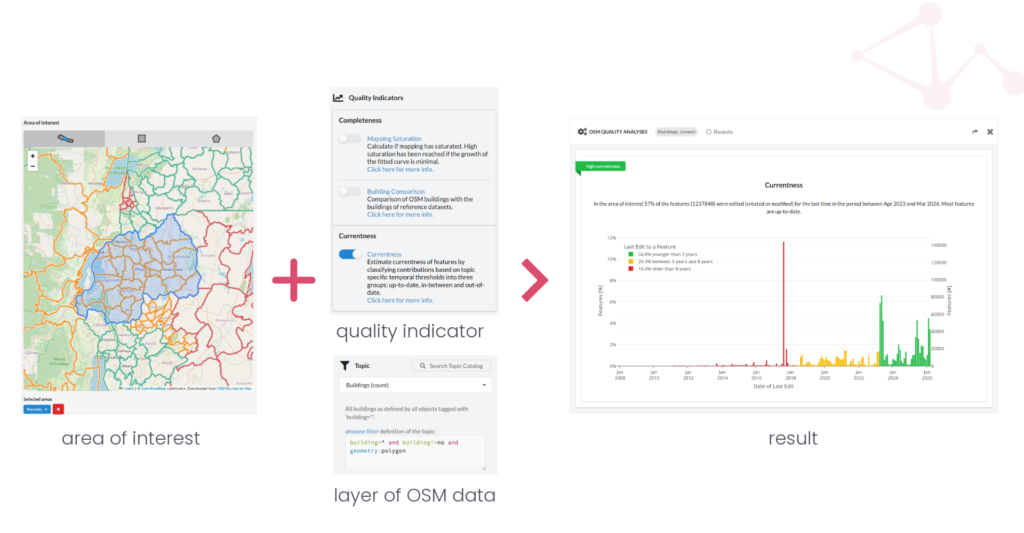
The country reports build on existing components such as ohsome, the ohsome dashboard, and the ohsome quality API. Instead of generating indicators on demand, they provide preprocessed results in a more structured format.
Many of the indicators used in these reports have been further developed and improved as part of the OpenStreetMap Quality project in cooperation with the German Federal Agency for Cartography and Geodesy(BKG). This includes a significantly faster currentness indicator and the introduction of attribute completeness. It is fair to say that without BKG’s support, this level of analysis and usability would not have been possible.
Outlook
Looking ahead, we want to further develop these reports beyond their current focus on the HDX platform and core humanitarian use cases. In the future, we want to expand both the thematic scope and the depth of the analysis. This includes exploring topics such as bridges and aero ways. We want to move beyond general reporting and create more tailored assessments that better reflect specific use cases and data needs.
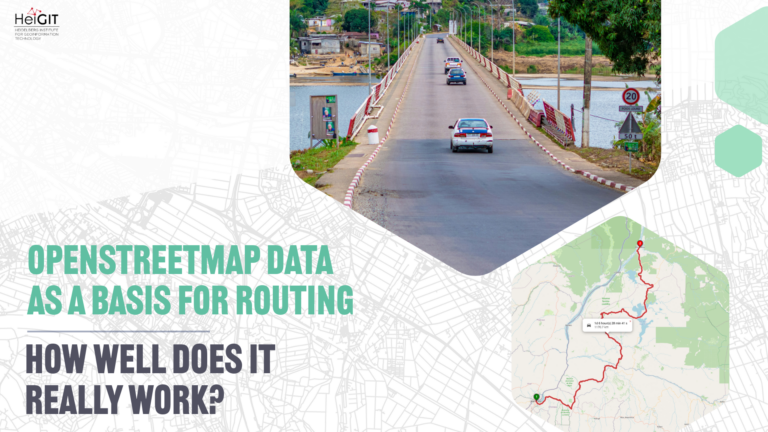
For openrouteservice, this means helping users understand how reliable routing may be in a given country or region. For the Climate Action Navigator, the goal is to better assess the reliability of land consumption estimates based on the underlying data and to determine when bicycle infrastructure was last updated.
Stay tuned!
The dashboard: ohsome Country Quality Report
The dataset on the HDX: https://data.humdata.org/organization/heidelberg-institute-for-geoinformation-technology?q=OSM Data quality&ext_page_size=10