HeiGIT and the Walk21 Foundation have been collaborating to strengthen how urban walkability is assessed. Walk21 has contributed its expertise on walking and experience of working with cities and practitioners to help identify and refine the factors that matter when assessing a walkable environment. HeiGIT has developed an array of new indicators to expand hiWalk, an assessment tool for walkability integrated into the Climate Action Navigator, an open-source dashboard for high-resolution climate action data.
New Walkability Indicators
The assessment tool hiWalk evaluates the walkability of streets and neighborhoods through indicators such as path categories, surface quality, greenness, and network connectivity, drawing primarily on OpenStreetMap (OSM) data. In contrast to many other walkability indicators, hiWalk is guided by the question “Do people want to walk here?” instead of “Can people walk here?”. City administrations and civil society organizations can use hiWalk to identify barriers to walking and prioritize action.
Building on the existing tool, we have added several additional indicators to the dashboard:
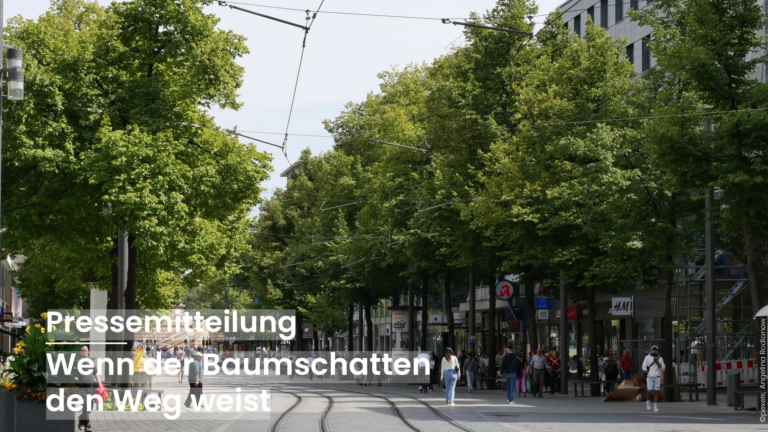
Tree Shade: Does my path have enough shade to walk comfortably also on hot, sunny days?
The Tree Shade indicator shows how much of a path is shaded by tree canopy at least two meters tall. The indicator relies on a global canopy height dataset and estimates shade as the direct overlap between canopy and path, corresponding to conditions at solar noon. This approach makes it possible to compare cities worldwide while providing a conservative estimate of heat stress when walking on hot days.
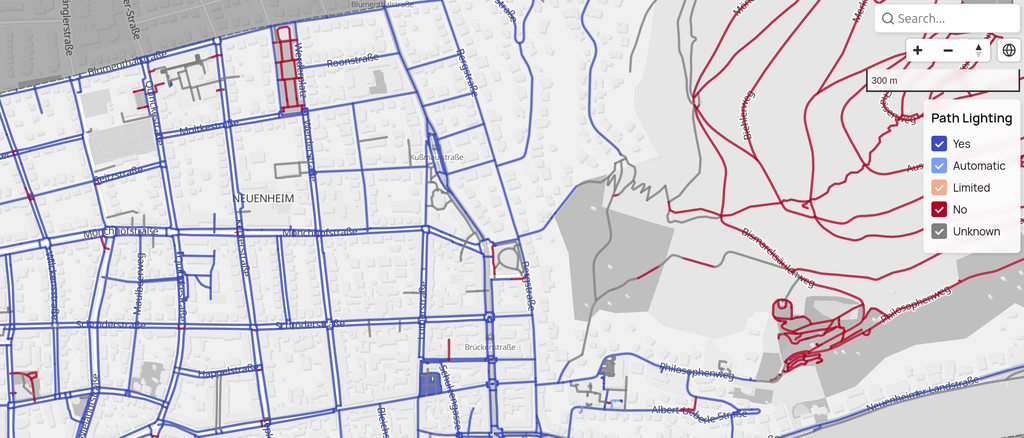
Path Lighting: Is my path well-lit at night, or do I have to walk in the dark?
The Path Lighting indicator classifies paths according to nighttime illumination, from continuously lit to unlit. Streetlamps and other path lighting are mapped based on OpenStreetMap tags. Adequate street lighting supports both actual and perceived pedestrian safety, as well-lit paths make walking after dark safer and more pleasant, especially for women.
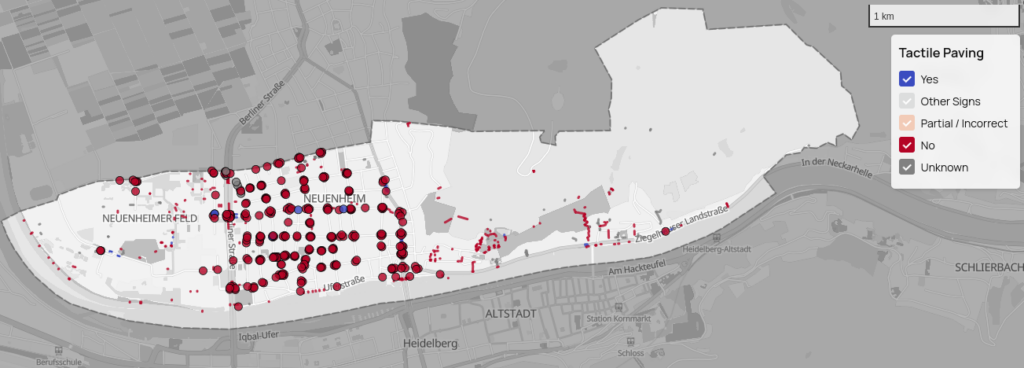
Tactile Paving: Can I navigate my path safely if I have a visual impairment?
This indicator classifies pedestrian crossings by the presence and correctness of tactile paving, contributing to showing how inclusive urban infrastructure is. Based on OpenStreetMap tags, it indicates where pedestrians with reduced vision can navigate crossings safely, and where infrastructure for pedestrians with visual impairments is lacking.
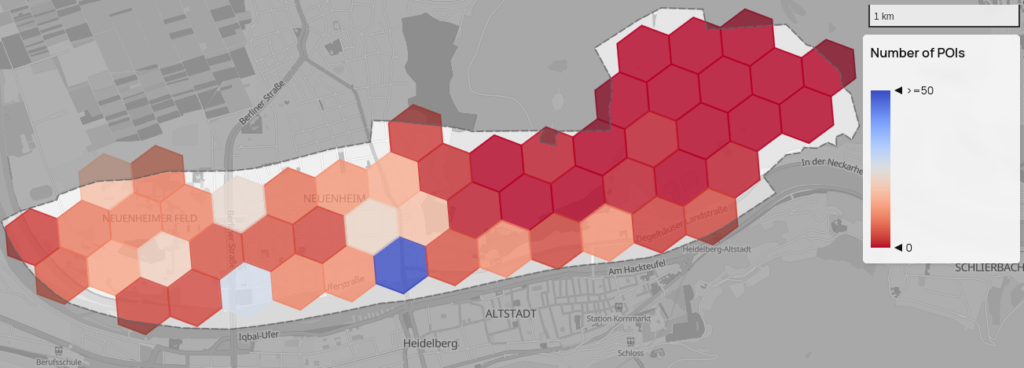
Point of Interest Variety: Are all services I need in daily life within walking distance?
The Point of Interest Variety indicator gives an overview of how many different amenities or Points of Interest are nearby, which influences the overall walkability, liveliness, and attractiveness of an area. The indicator takes into account essential facilities and everyday services such as education, childcare, healthcare, supermarkets, public transport, green spaces, culture and leisure, eating out, and pet care. It shows the number and the types of Points of Interest available in each neighbourhood. This sheds light on how much of daily life can be carried out on foot, in line with concepts such as the 15-minute city.
More indicators for walkability
Walkability has many facets that can be assessed with local data. Some of the latest indicators we have added to hiWalk include:
- Slope, showing the steepness of walking routes;
- Public Toilets, which maps the location of, and distance to, public restrooms;
- Benches, marking public resting spots and now also identifying sheltered benches that offer protection from sun or rain;
- Pedestrian Crossings, which shows the location of, and distance to, marked road crossings.
Explore the Data for Your City with the Climate Action Navigator
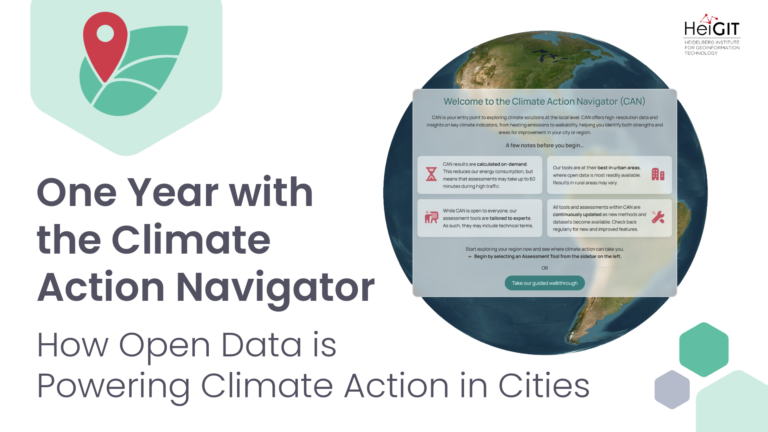
The Climate Action Navigator offers several climate action assessment tools and indicators not only on walkability, but also on bikeability, land consumption, land use and land cover (LULC) change, residential heating emissions, CO₂ budgets, traffic emissions, and rooftop solar panels. The Climate Action Navigator is always in progress, as the assessment tools are constantly improved to meet the needs of our partner organizations. It is completely open source and free of charge. More information is available on the project webpage.
Anyone can access the data by creating a free user account on the the Climate Action Navigator and explore any city or neighborhood with the assessment tools. Log in and select hiWalk to visualize data on walking path surface quality, type and smoothness, benches and drinking fountains, street lightning and tactile paving, tree shade and greenness, and more.
If you want to contribute to the development of further indicators, we welcome collaboration with NGOs, citizens’ initiatives, or city administrations with specific use cases. We also invite research institutions interested in contributing to the scientific foundation of our tools. Contact us at climate-action-navigator@heigit.org.