Hello and welcome back to the How to become ohsome-blog series! We hope the new year started off well for you!
If you’re new to the series, you should read our other posts in the series, as well as the posts in our ohsome Region of the month series, like this one. As already mentioned in part one of the contributions blog posts, we would like to introduce you to our new endpoints /contributions/count and /contributions/latest/count with a short use case today.
For this, we will look at the contributions of the tags “amenity=cafe” and “amenity=restaurant” of the type “node“.
Boundaries
As usual, we got our administrative boundaries file from here. For this example use-case, we decided to take a closer look at Manhattan, New York City.
Requests
For this request, the /contributions/count and /contributions/latest/count endpoints are of course the starting point of the requests which were sent to the ohsome API.
Endpoints:
With the help of the contributions endpoint the user is able to track new creations, changes of the geometry or the tag and deletions of objects in OpenStreetMap. The endpoint does not only allow to look at newly added data to OpenStreetMap, but also further work that is done on it subsequently. There are several options to choose from, such as the absolute number of changes. They can also be output as the relative value density, which gives out the amount of contributions divided by the size of the examined area in square-kilometers.
Last but not least, there is also the possibility to query via /latest/count or /latest/count/density, how many changes have been made to an entity most recently, so only the latest changes are considered in the output value (or values depending on how many values you have per response).
For our use case, you can find the snippet with all files used and requests sent here.
Results
/contributions/count:
Below you can see a graphic of the overall contributions that took place every month in Manhattan throughout the years (2010-2020):
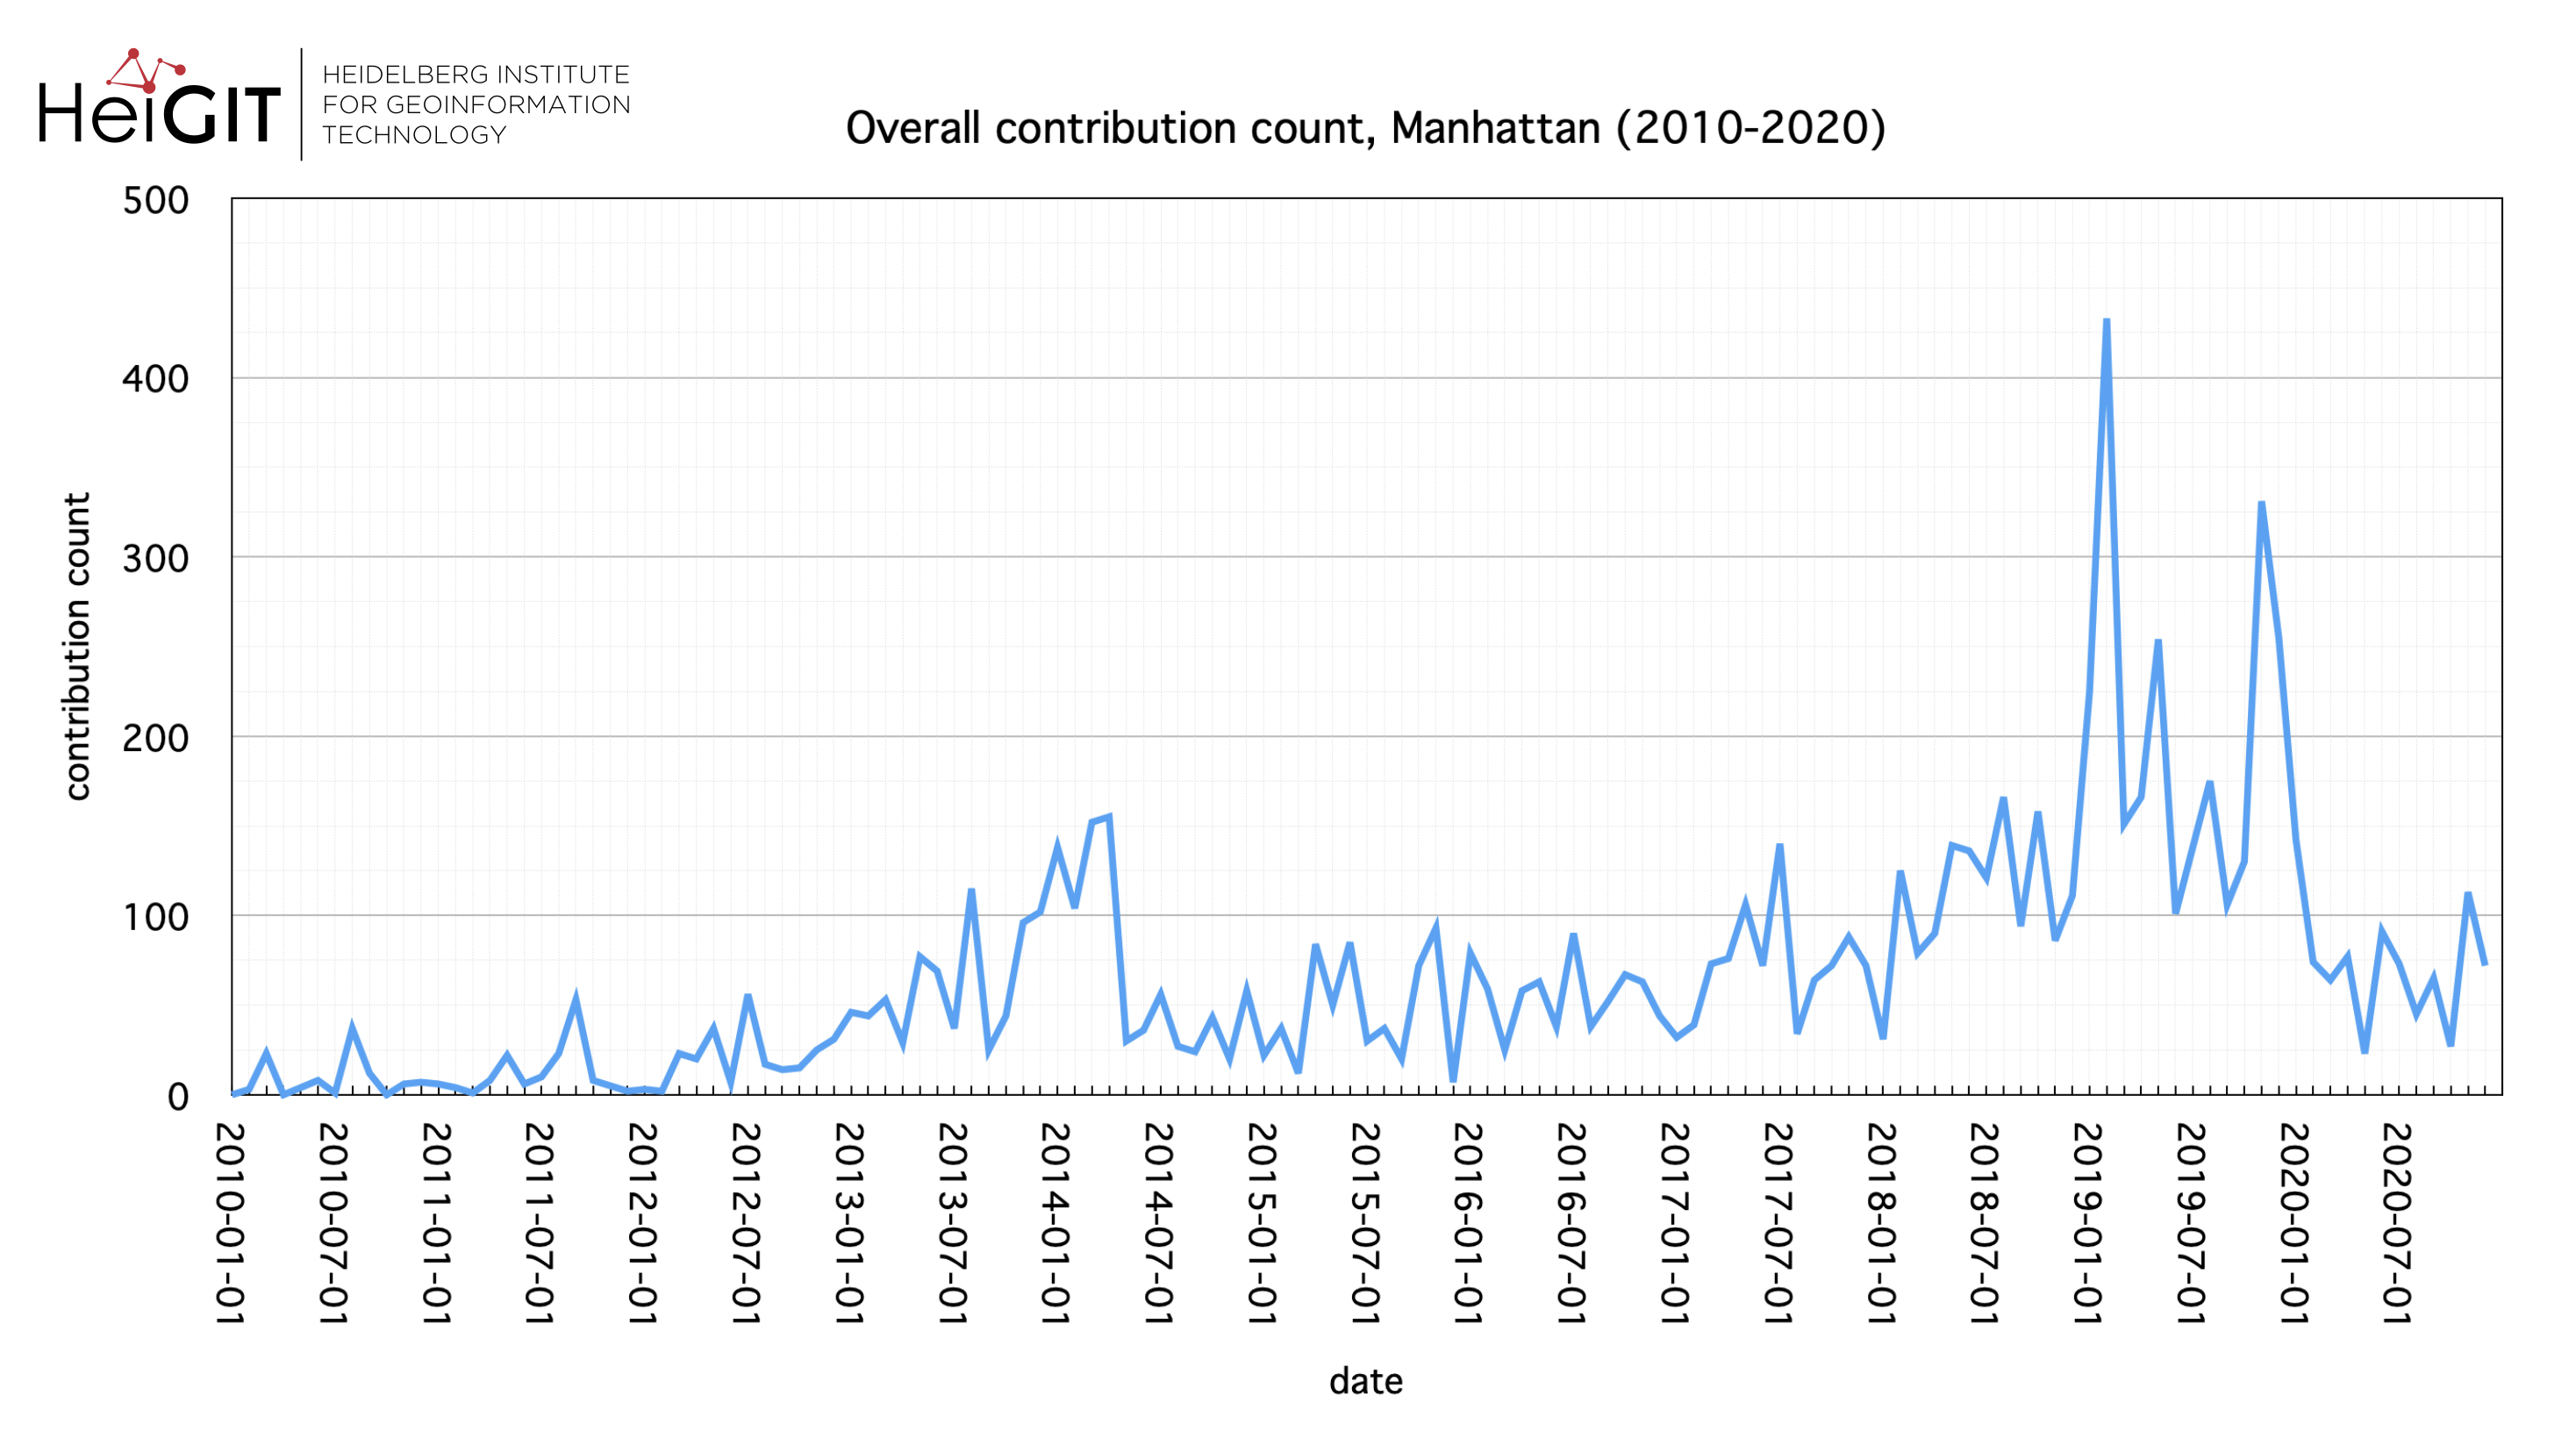
The years 2019 and 2020 seem to have meant a particularly high number of contributions for Manhattan, with the peak value being reached between January and February 2019.
To get more information about the contribution type, you have the option to select a specific contribution type in the request. For example, if you are only interested in newly added objects, you can specify them in your request as follows:
[…]&contributionType=creation&[…]
Below you can see a graphic of the mean of the overall contributions that took place every month in Manhattan throughout the years (2010-2020) sorted by their type:

If we look at the different contribution types for the same period (2010-2020), the creation of new objects and the adjustment of tags are the most common on average.
/contributions/latest/count:
Below you can see a graphic of the latest contributions that took place every month in Manhattan throughout the years (2010-2020):
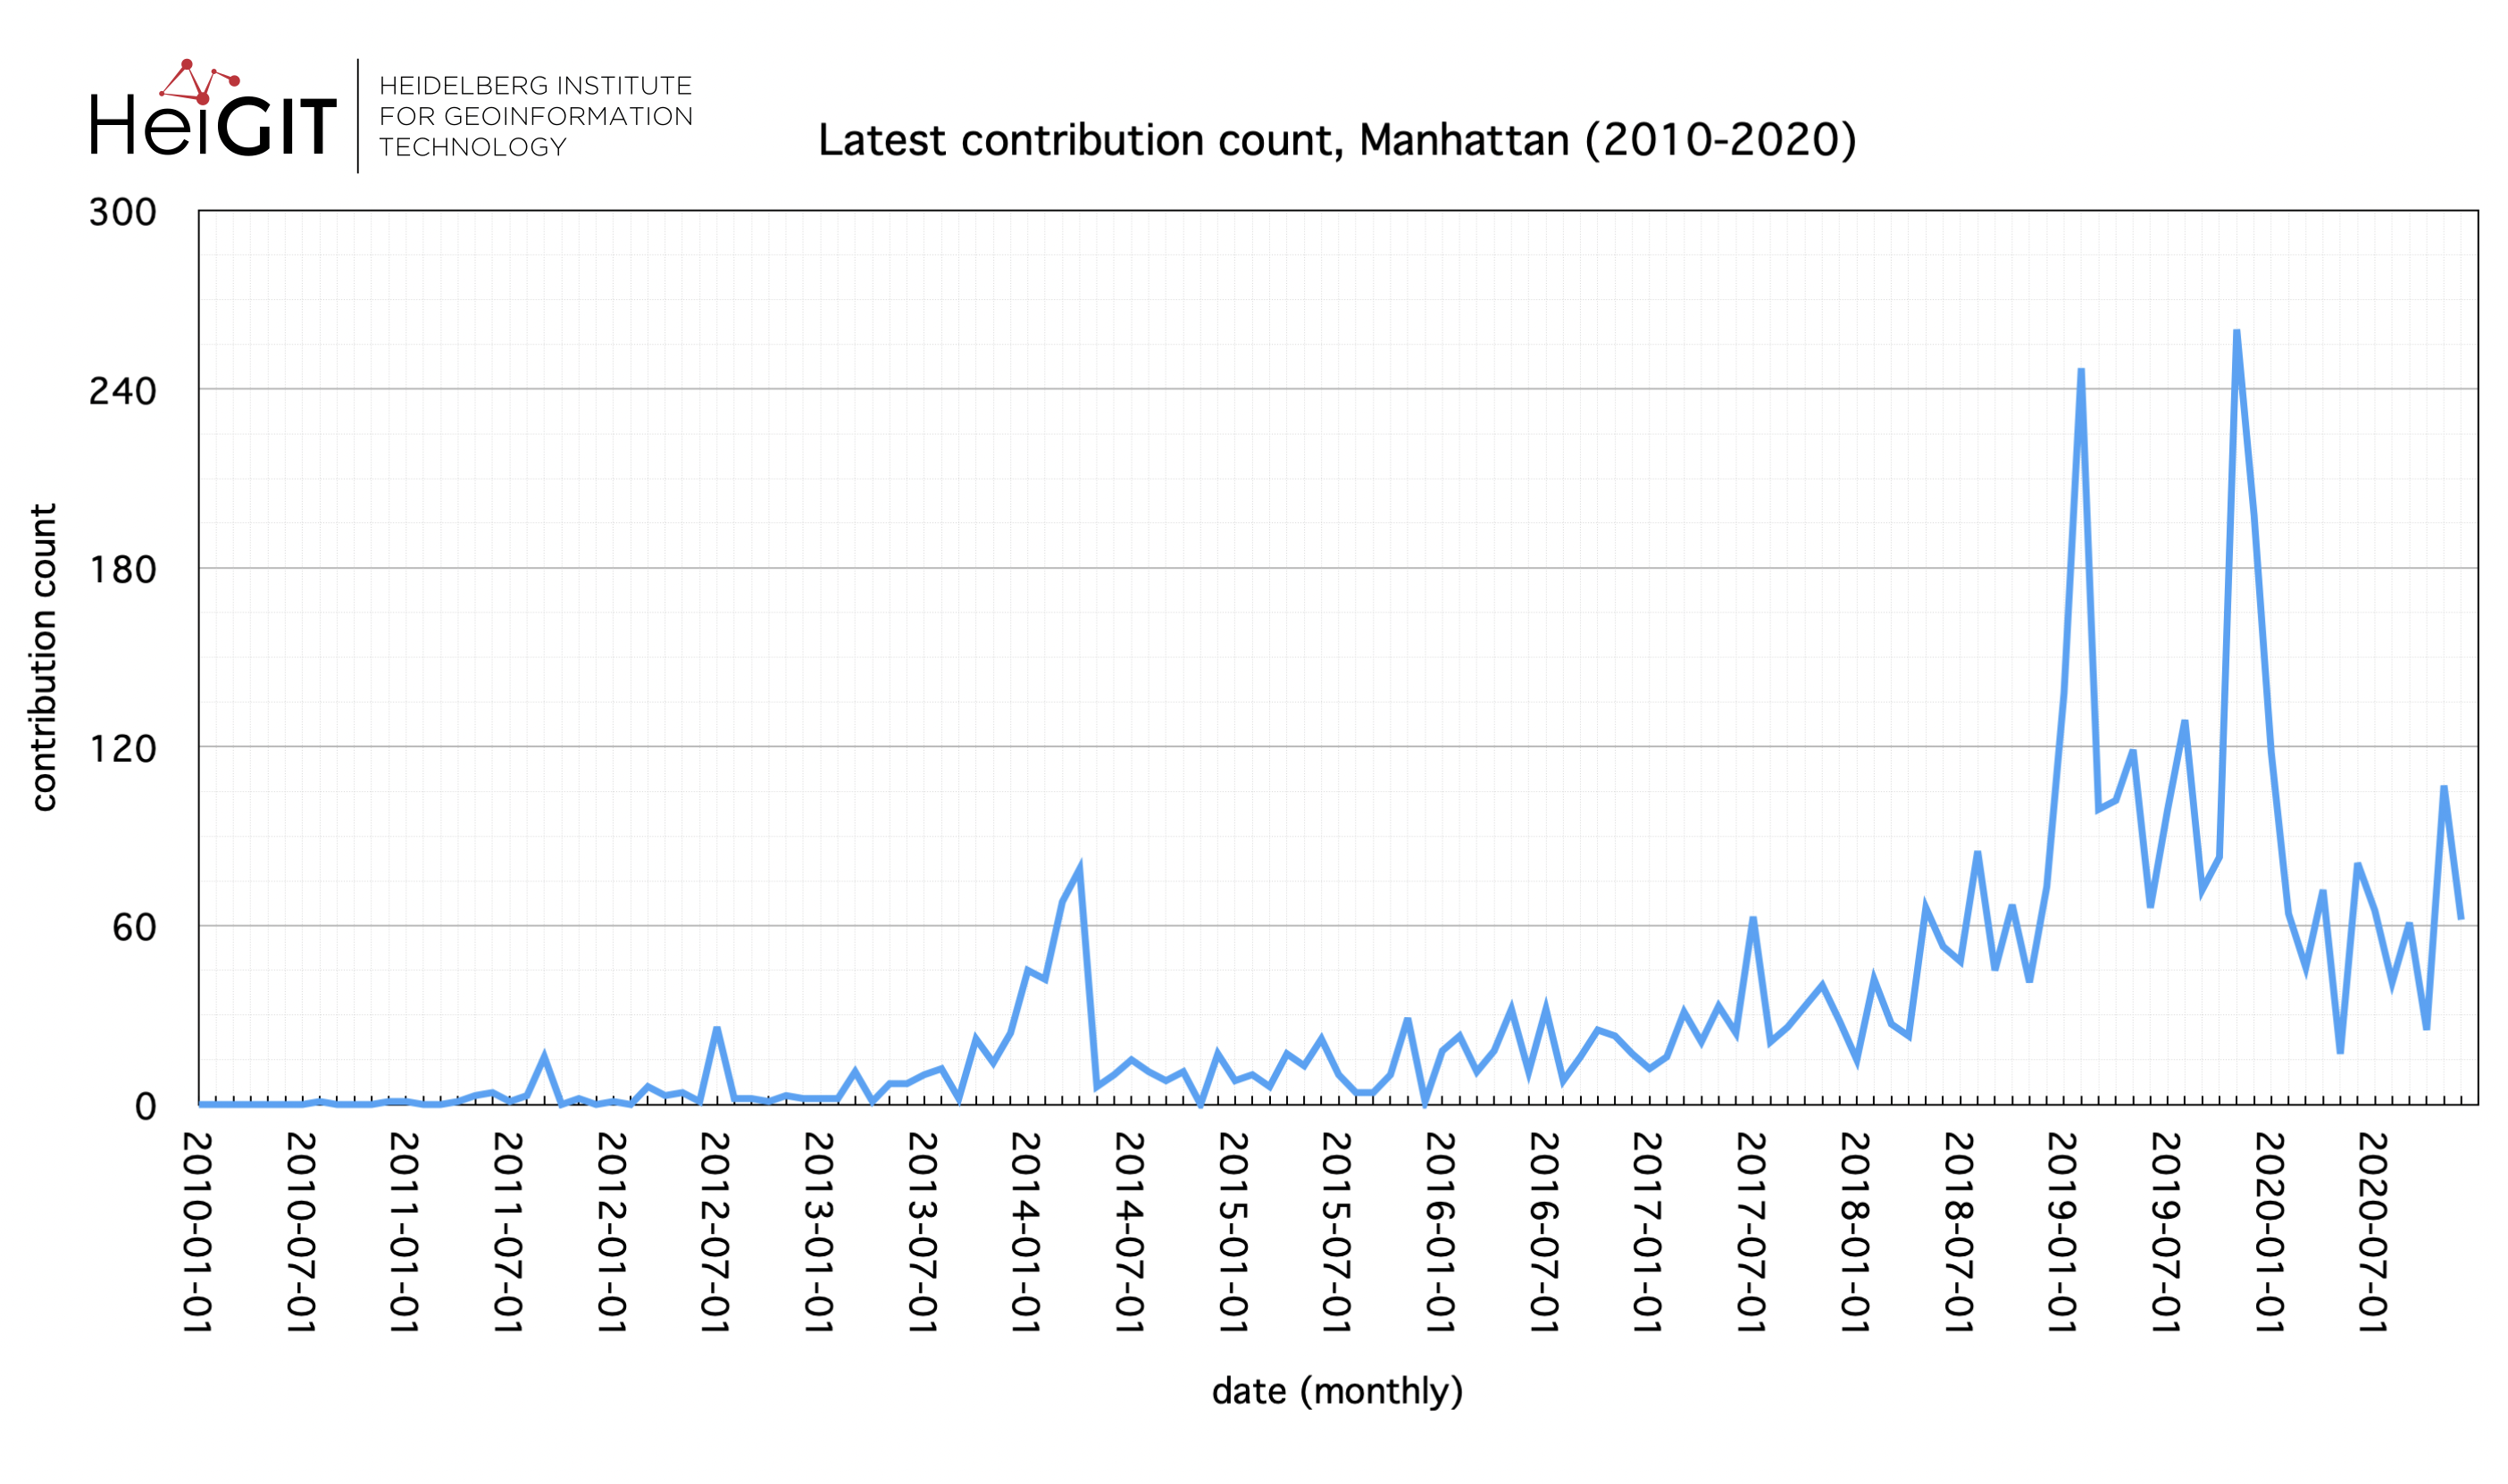
As one might expect, the graph of the latest contributions shows a similar development, but with lower numerical values. The reason for this is, as mentioned at the beginning, that only the most recent contributions within a monthly time interval are considered. However, it is interesting to note that although the peaks still occur at the same time, the maximum value is no longer reached between January and February 2019, but instead between October and November 2019.
Below you can see a graphic of the mean of the latest contributions that took place every month in Manhattan throughout the years (2010-2020) sorted by their type:
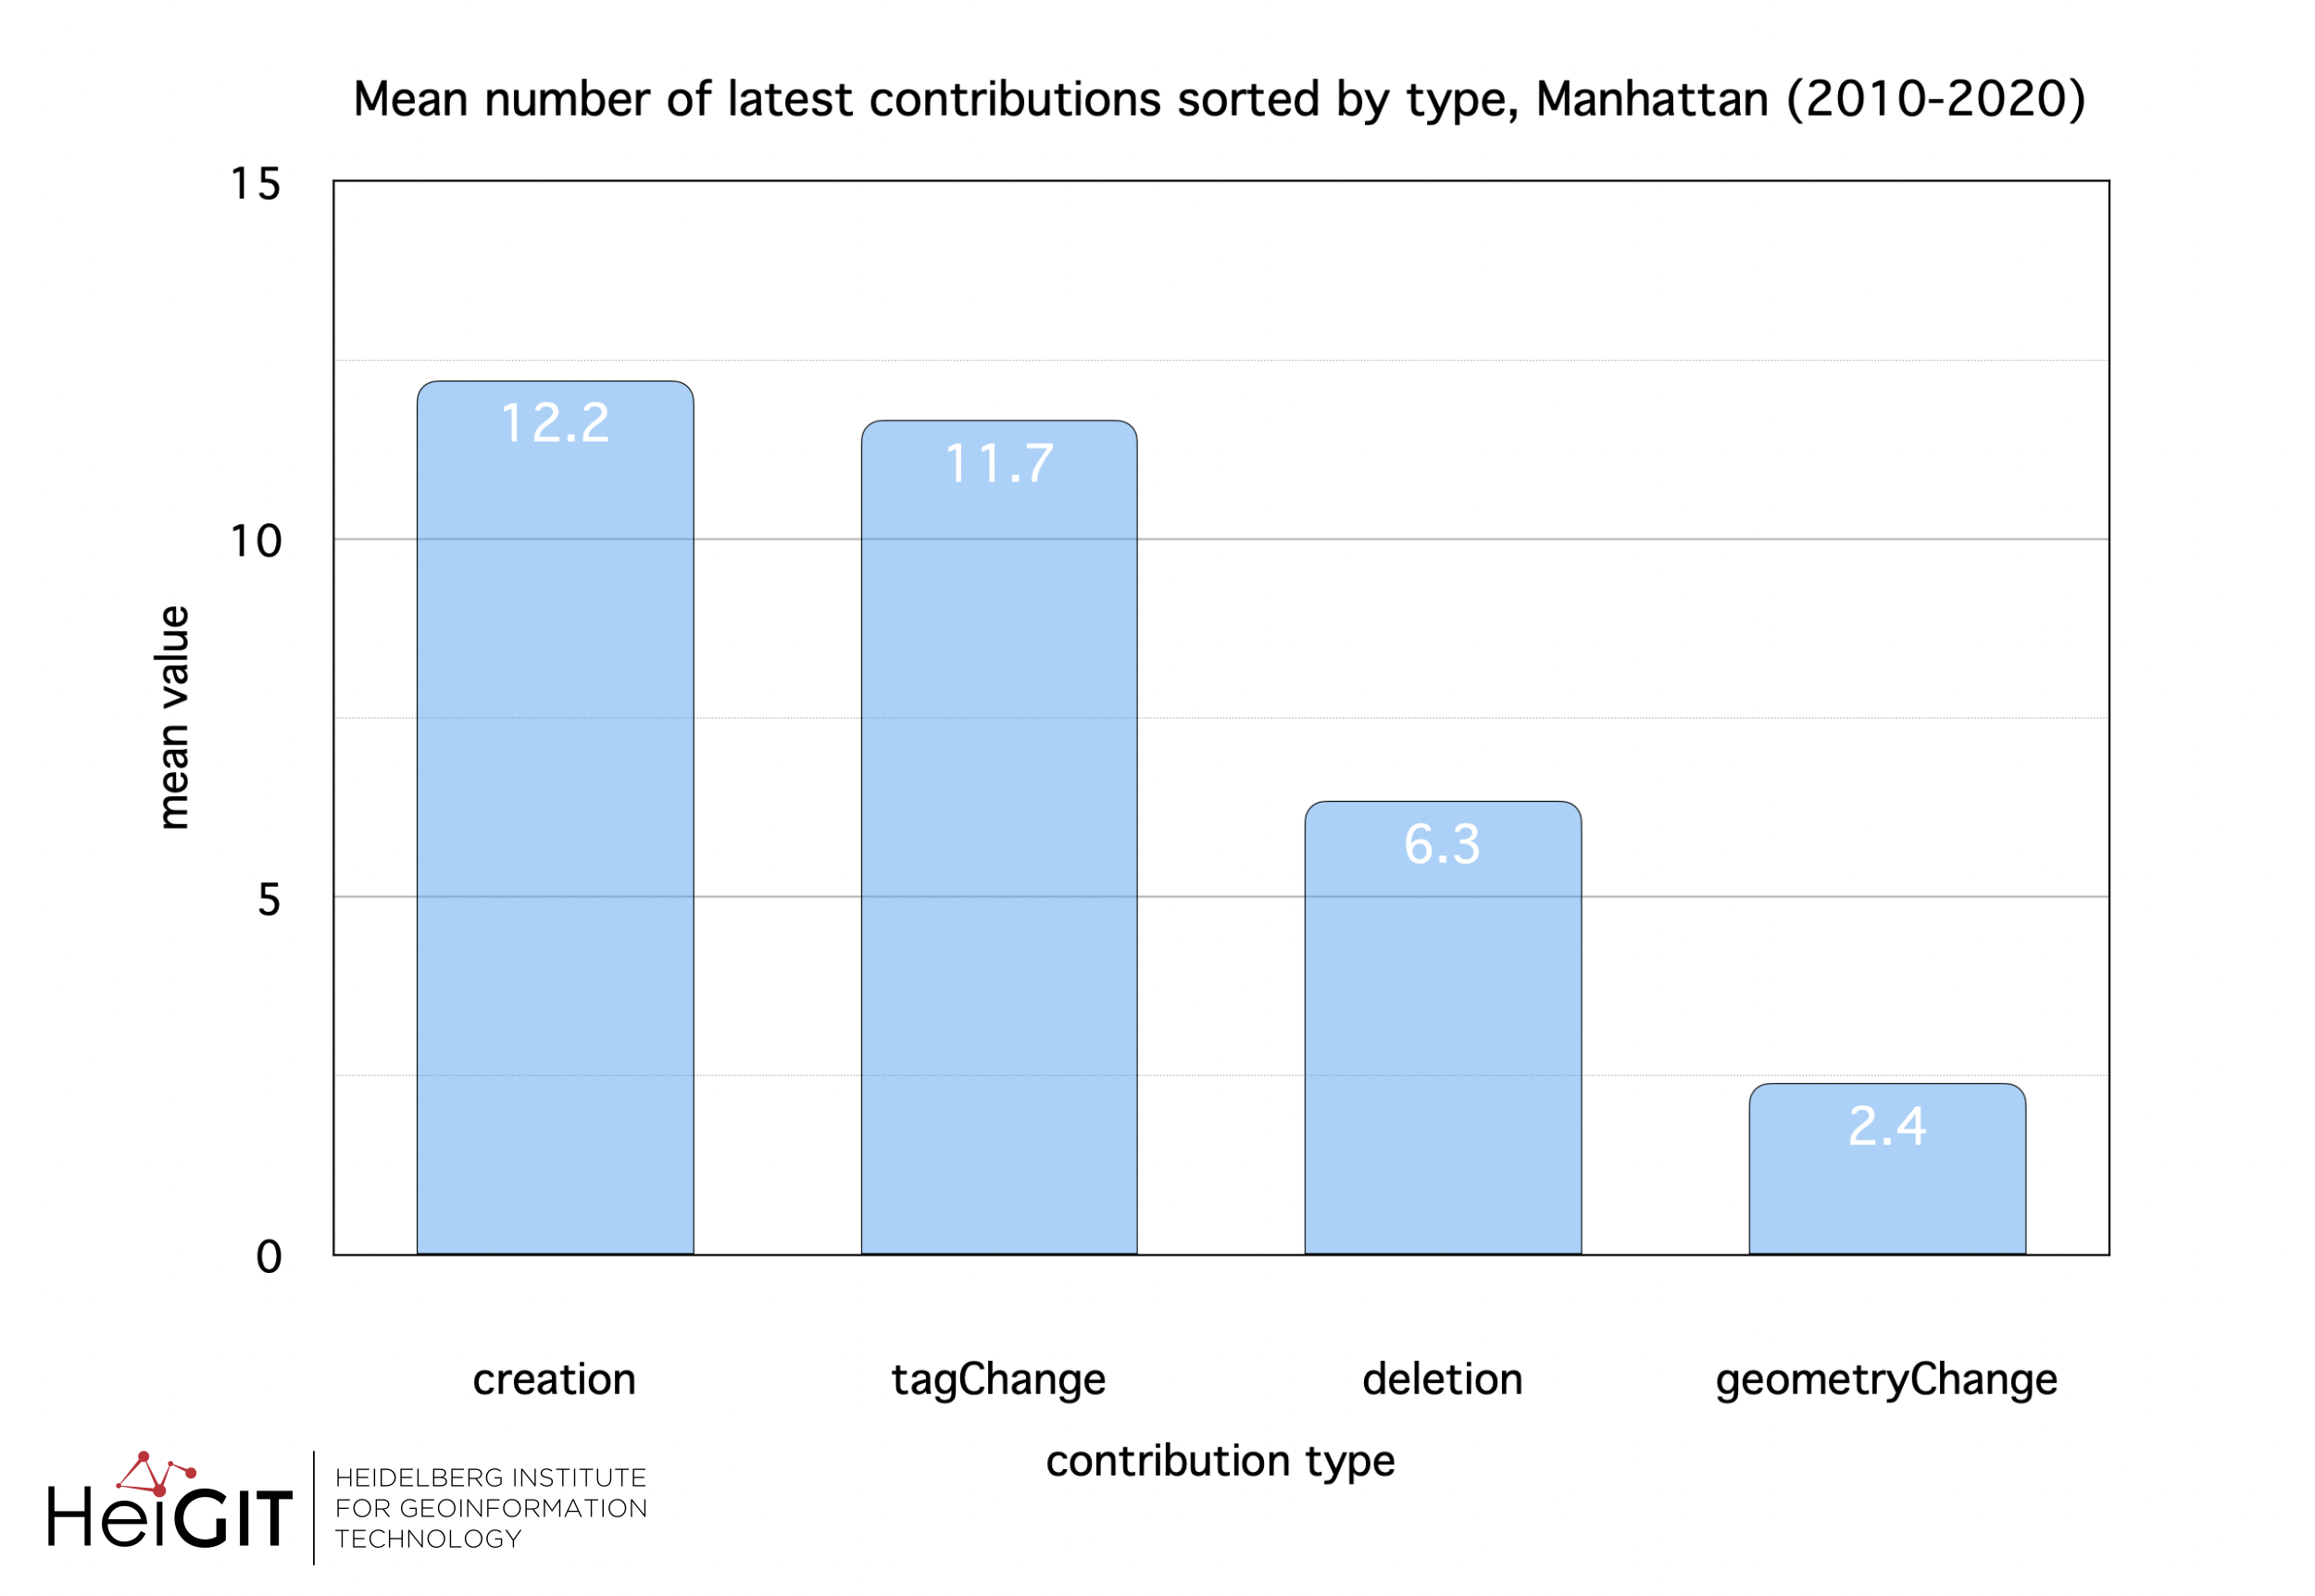
If you separate the contributions into their type, you can see the same ranking in the average occurrence of the different contribution types. However, the type deletion seems to have relatively higher values than geometryChange, although these two were still more or less on the same level in the request of the overall contributions.
/contributions(/latest)/count/density:
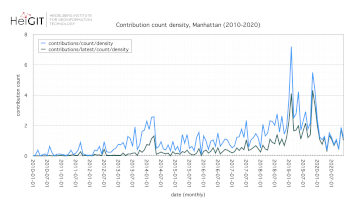
Below you can see a graphic of the (latest) contribution density of every month in Manhattan throughout the years (2010-2020):
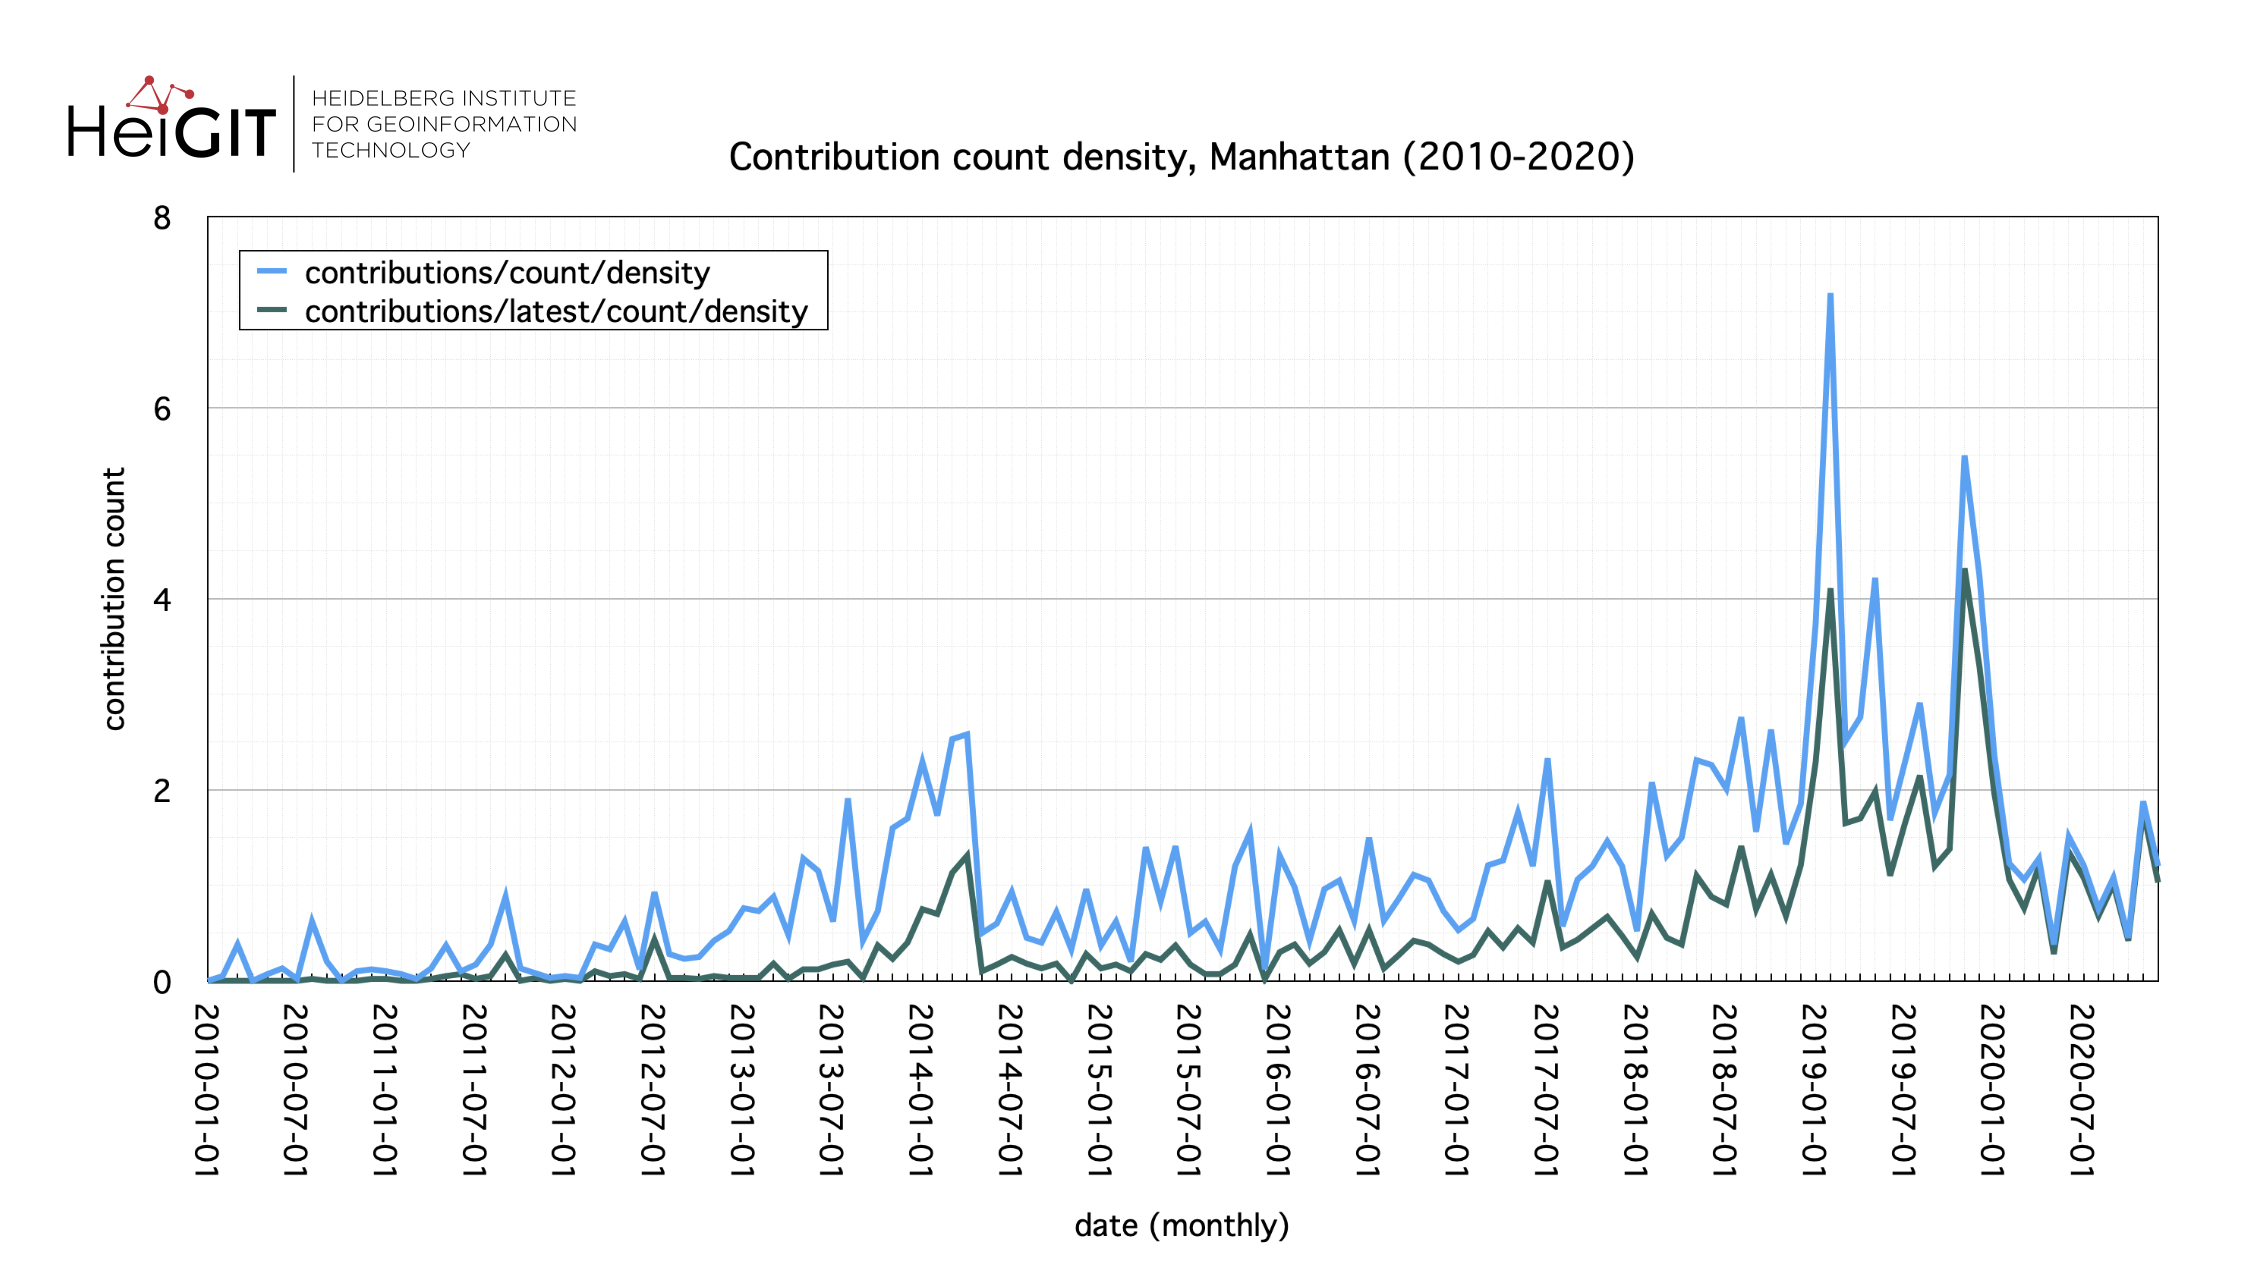
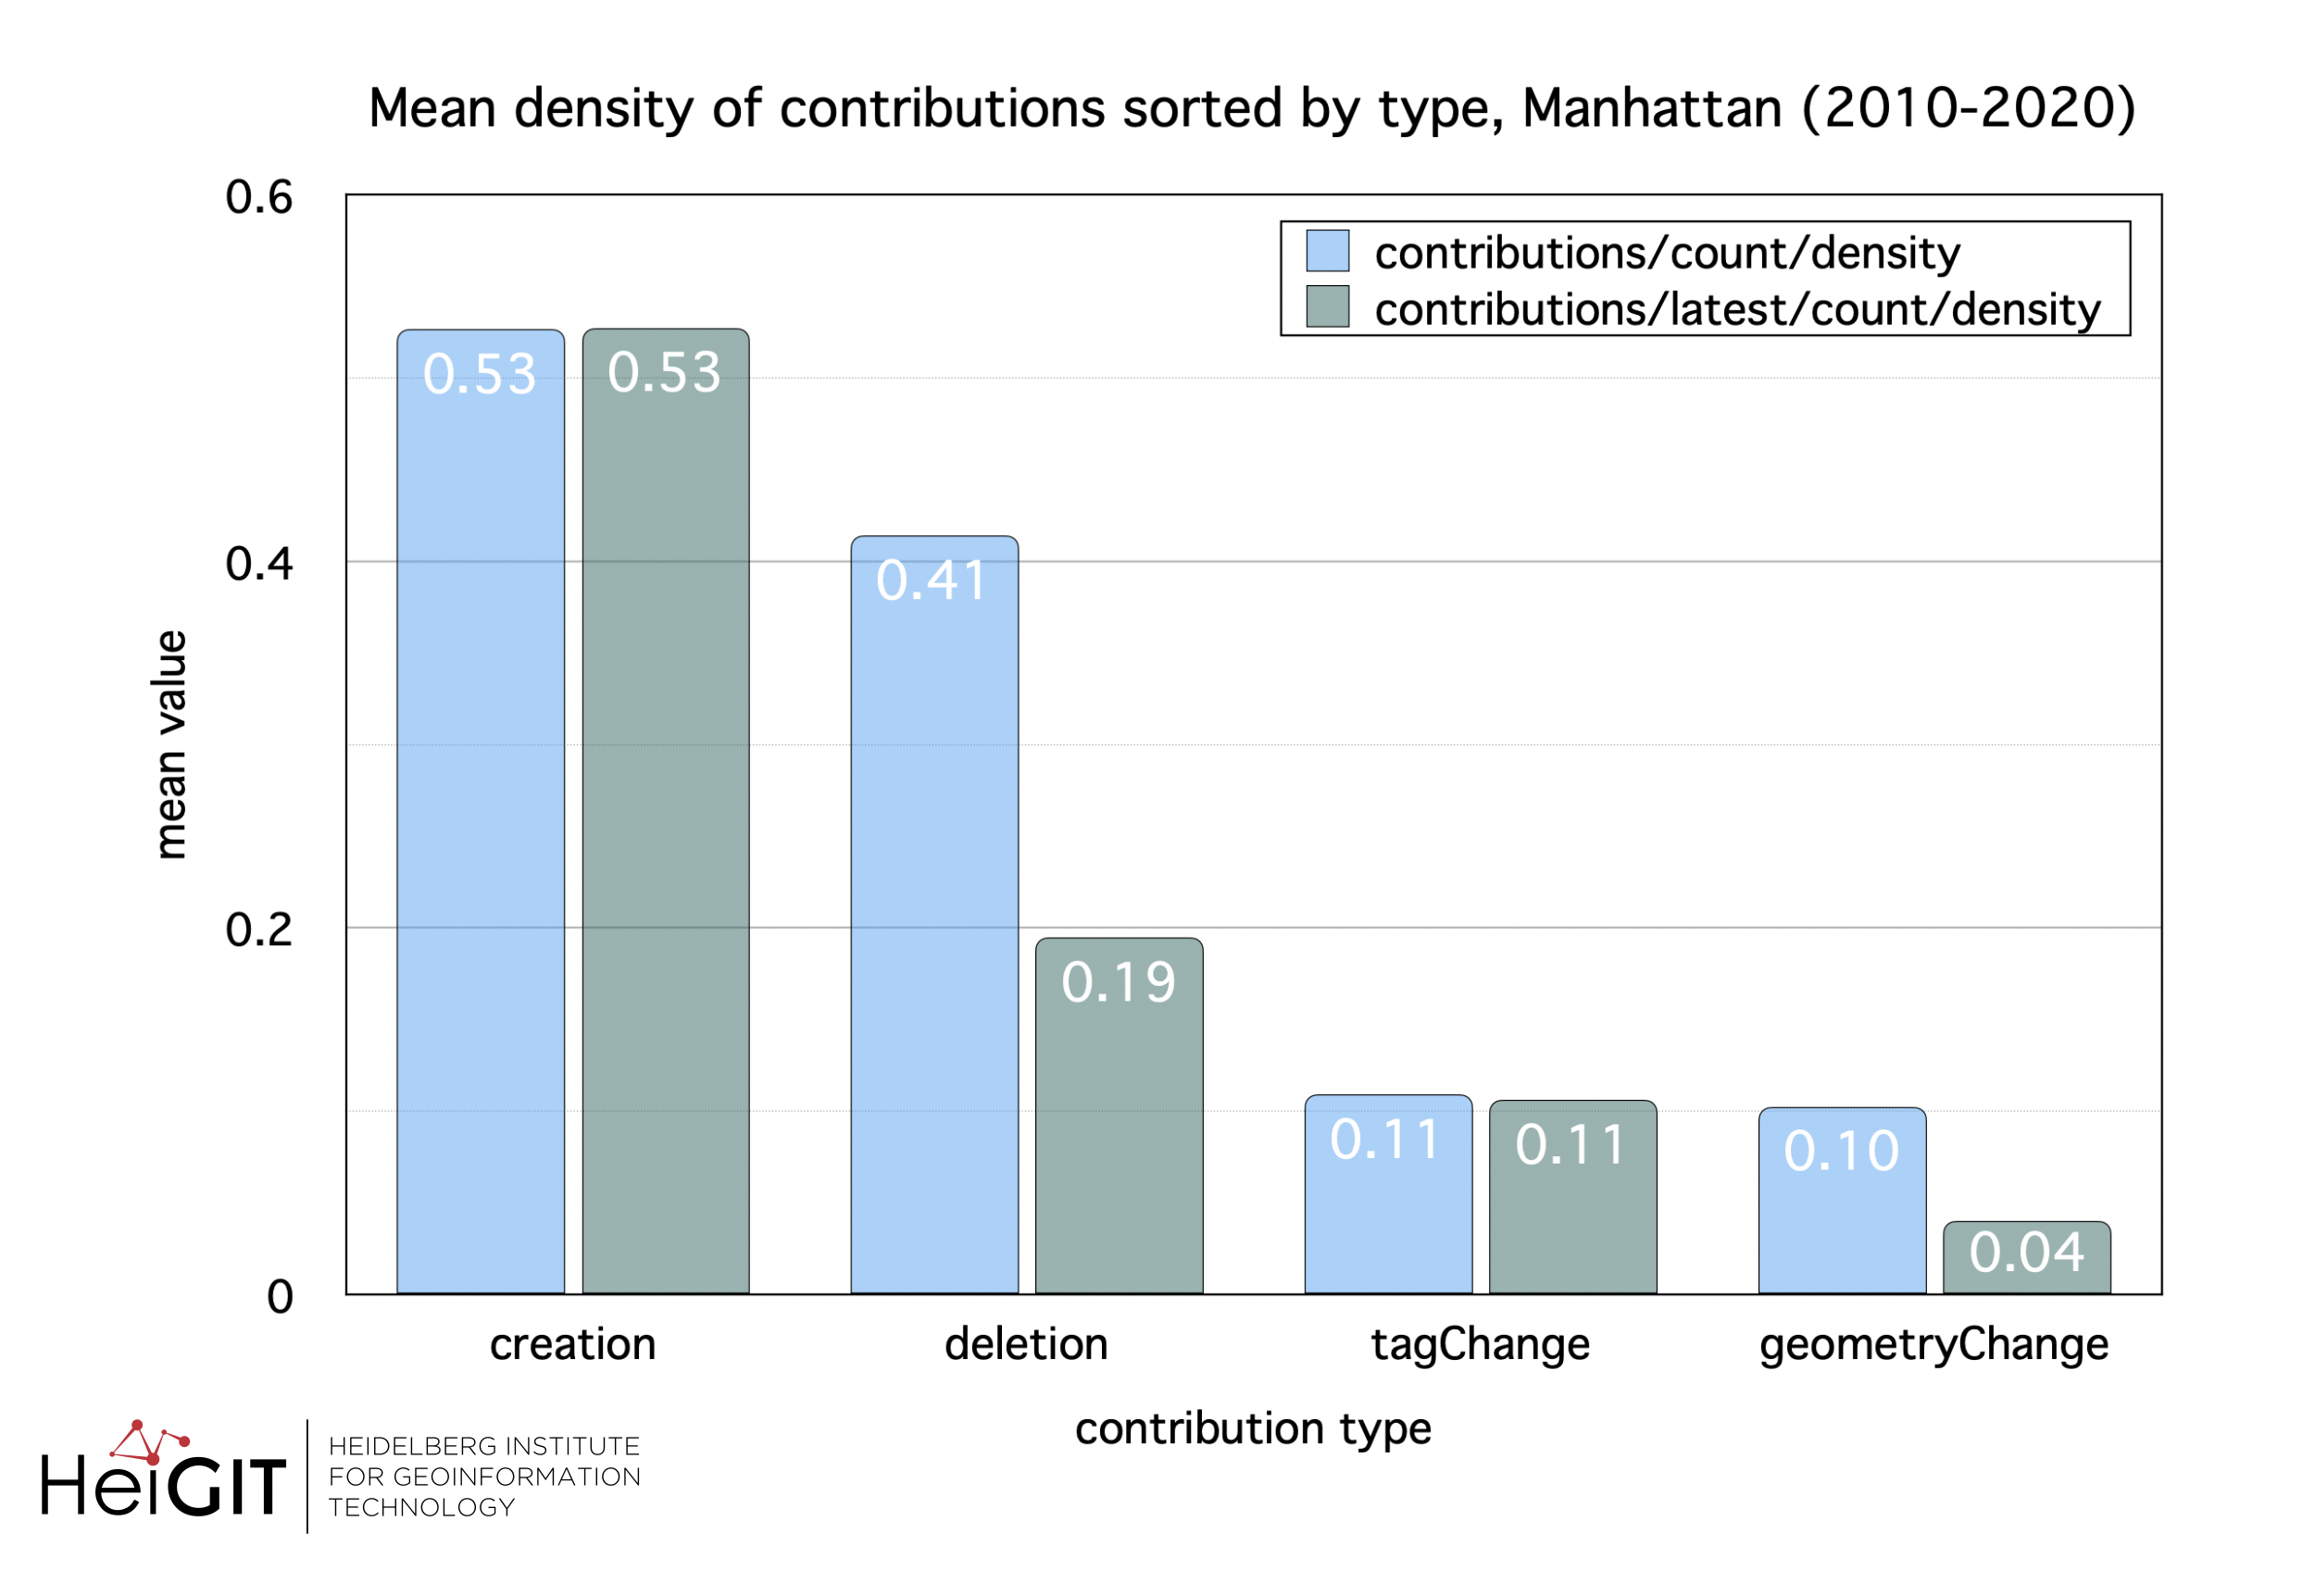
Below you can see a graphic of the mean density of the (latest) contributions that took place every month in Manhattan throughout the years (2010-2020) sorted by their type:
Thank you for reading our new blog post of the “How to become ohsome” series! We hope it was a helpful addition to the previous posts.
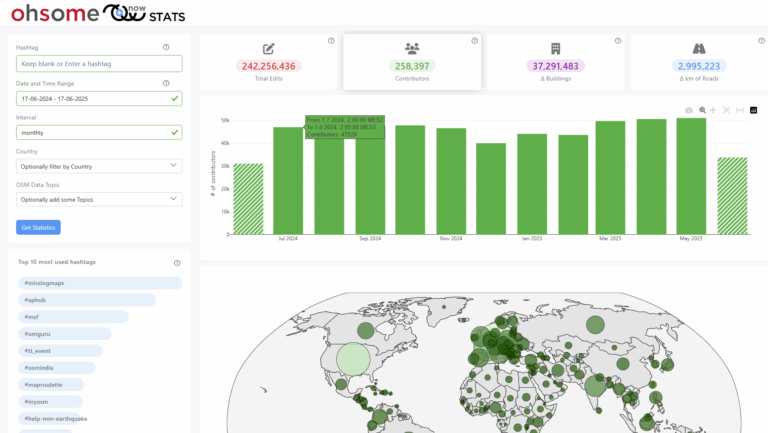
Background info: the aim of the ohsome OpenStreetMap History Data Analytics Platform is to make OpenStreetMap’s full-history data more easily accessible for various kinds of OSM data analytics tasks, such as data quality analysis, on a regional, country-wide, or global scale. The ohsome API is one of its components, providing free and easy access to some of the functionalities of the ohsome platform via HTTP requests. Some intro can be found here:
- ohsome general idea
- ohsome general architecture
- how spatial joins queries work in the OpenStreetMap History Database OSHDB