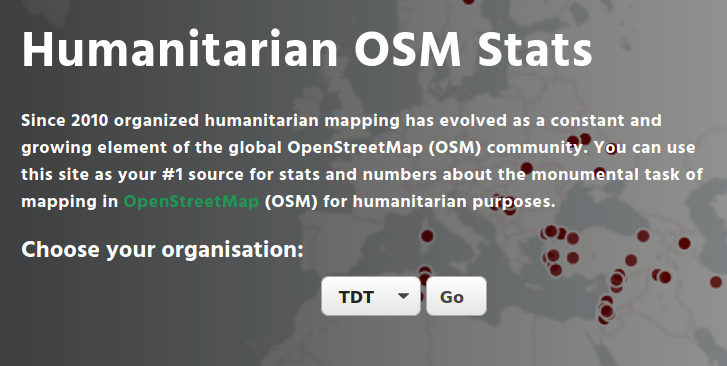
Since 2010 organized humanitarian mapping has evolved as a constant and growing element of the global OpenStreetMap (OSM) community. With more than 7,000 projects in 150 countries humanitarian mapping has become a global community effort. Due to this large amount of projects it can be difficult to get an overview on mapping activity. This is why we worked on the “Humanitarian OSM Stats” website to make it easier to find the information you are looking for. It combines data from the open-source Tasking Manager hosted by the Humanitarian OpenStreetMap Team (HOT) and information from OpenStreetMap (OSM) that has been processed using the ohsome OSM History Data Analytics Platform developed by HeiGIT.
This is the second blog post of a series of posts we are currently working on. If you are interested please reach out to us (benjamin.herfort@heigit.org) and we can try to cover your questions in a future post.
Again we will investigate the humanitarian mapping projects organized by Tanzania Development Trust (TDT). TDT is a volunteer run UK registered charity that has been supporting grassroots projects in rural Tanzania for 45 years. Getting lost while visiting these projects, and learning how the lack of maps hampered the work of their local rep and female genital mutilation (FGM) survivor and activist Rhobi Samwelly, chair Janet Chapman started Crowd2Map in 2015. Since then over 20,000 volunteers (as we will find out in this post) have added data to OSM and helped save an estimated 3000 girls from being cut. Anyone with an internet connection is very welcome to join TDT, so get in touch!
Goals
In this blog post we will pursue three relatively easy goals:
- Find out how long (e.g. the number of days) users have contributed to the mapping efforts of an organization (here we use Tanzania Development Trust).
- Find out how the mapping efforts are distributed among users.
- Find out which users have contributed most in the last month.
- Download all the data needed for the things above.
How to get the information from the website
- Visit the humstats.org website and select your organization and click on “go”. This will direct you to a new site with the statistics for the selected organization.
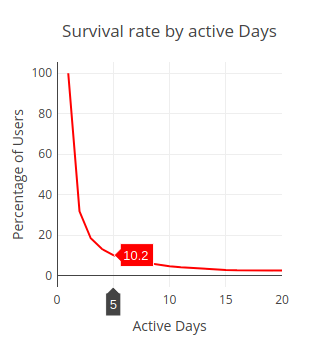
- Scroll down to the “Users” section or click on in in the header. The first figures visualizes the so-called “survival-rate”. It can give insights into long term involvement and motivation of users. For TDT around 10% of all volunteers used the Tasking Manager on 5 days or more. As for many crowdsourcing or volunteer projects there are many people who just contribute once, for TDT this represents about 70% of the users. Most mapping projects have the goal to grow the community of mappers. The “survival-rate” can help to find out if this is actually happening and if more users contribute more often.
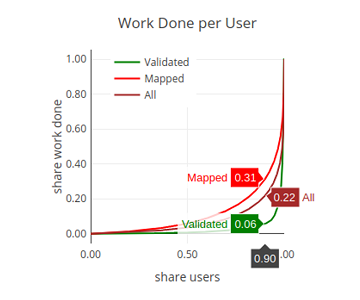
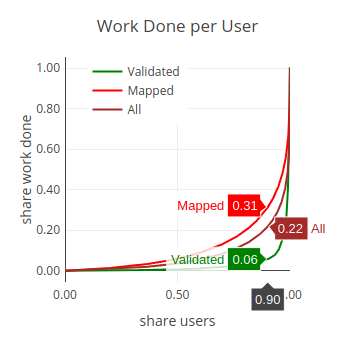
- Scroll down a bit further and take a look a the next graphs, the so-called “Lorenz curve”. This plot can tell us how the mapping in the Tasking Manager is distributed among users. A straight line would mean that every user does the same amount of work. The more curved the line is the more work is done by a small group of people. For TDT we can see that 90% of the users did 31% of the mapping and 6% of the validation. Conversely, this also means that 10% of the users did 69% of the mapping and 94% of the validation. Also this observation is somehow expected in a volunteered mapping project (e.g. see the 1% rule). But again it can help us to understand how sustainable the mapping community is. Ideally there is a large group of users who contribute and the overall mapping should not only depend on the motivation of few individuals.
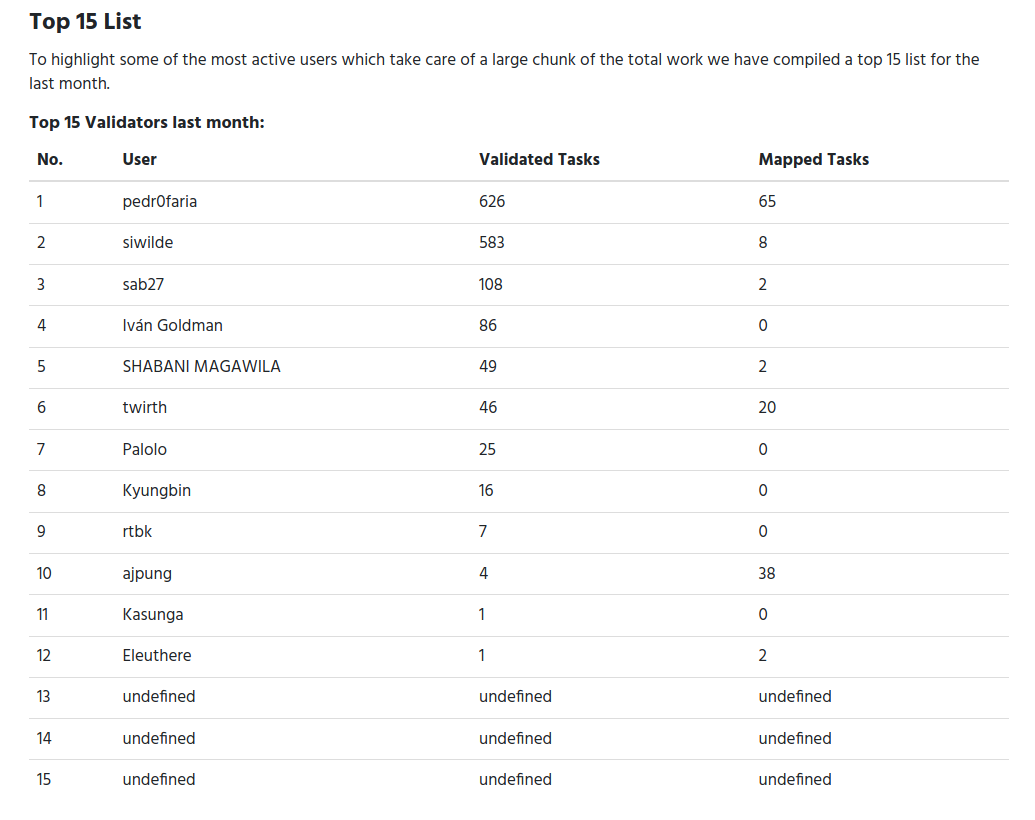
- Finally let’s take a look at who contributed most. Here we will consider validation in the Tasking Manager, which is a crucial step to ensure that the data added to OSM is of high quality. In the last month (in the example December 2020) 12 users validated tasks. With a great margin “pedr0faria” and “siwilde” are leading the way when it comes to validation in this month. I think this is the time for a big “Thank You”. Hopefully other users will be able to catch up in the next months.
Download the data in a spreadsheet
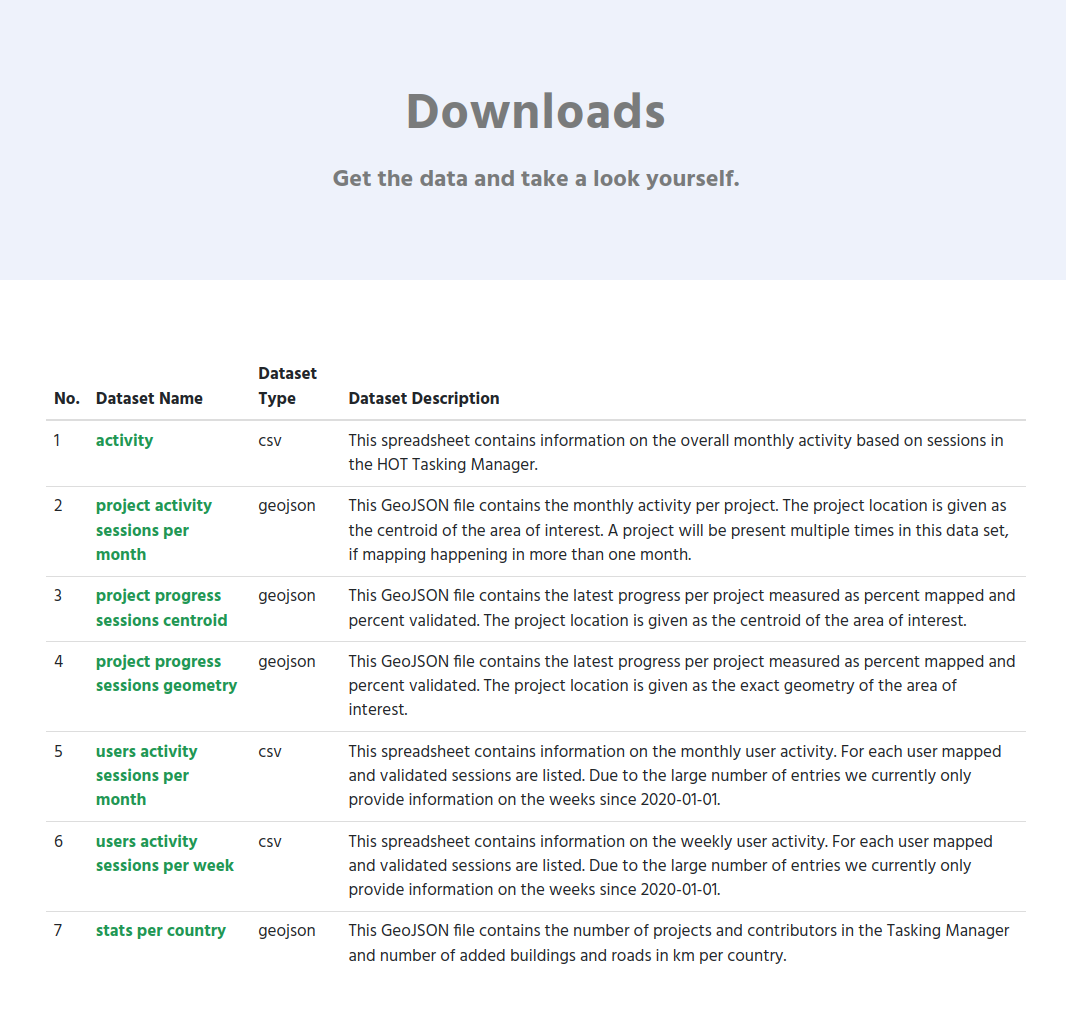
If you are interested to get the data behind these numbers and plots continue reading. On the website we offer a list of files to download. The user_activity_sessions_per_month.csv is the one that you need for the purpose described in this blog post. For instance for Tanzania Development Trust this file will be located here: https://humstats.heigit.org/api/export/tdt/users_activity_sessions_per_month.csv (There is also a file which provides these numbers on a weekly basis.)
To be continued
In the next blog post of this series we will take a closer look at the geographic locations of mapping projects. (For this we will choose a different organization, since all of TDT’s projects are based in Tanzania, this would have been too easy. ;))