The ohsome-py Python package is a client for the ohsome API, designed to facilitate the extraction and analysis of historical OpenStreetMap (OSM) data. The package simplifies handling API requests and responses by converting them into pandas or GeoPandas data frames, making data analysis and visualization easier.
With ohsome-py, you gain all the functionalities of the ohsome API through Python commands. Whether you’re conducting time series analysis, spatial data extraction, or exploring temporal trends, this package allows you to interact with OSM data in a more efficient and intuitive way. It handles everything the ohsome API can do, including bounding box queries and aggregation of contribution statistics—making complex OSM data accessible.
Since version 0.1 the library has been continuously maintained and improved to keep up with the latest evolvements in the ohsome-API as well as in the python ecosystem. Here is an overview of some updates and improvements we released:
- OSM is a great project but the open nature of the tagging scheme can pose a big challenge to data consumers. Extracted data frames can get very wide depending on the diversity of the extracted data. In v0.3 we introduced a mechanism that will keep tags in a JSON column until you choose to explode them from there. This helps you to keep your data frames tidy and extract only the information you need in your pipeline.
- We’ve made the data input process more Pythonic, providing a smoother abstraction layer between your code and the ohsome-API.
- Numerous bugs, both big and small, have been fixed, enhancing the library’s overall stability. A notable improvement is that the library now respects your logging configuration while still making effective use of logging throughout.
- Dependencies have been updated to the latest versions, including geopandas 1.0, pandas 2.0, and numpy 2.0. If your code is still relying on an older version of these libraries, feel free to stick to the 0.3.3 version of ohsome-py until you are ready to upgrade. We also test our tool against the latest python versions to avoid incompatibilities.
- Error handling has been refined to improve the experience when issues arise. This includes writing comprehensive error-logfiles that can be used to easily reproduce a query and report issues to the ohsome framework.
As users of the library ourselves—in tools such as the OSM Element Vectorisation Tool or our Climate Action platform, and research projects like GeoWiKI—we are committed to continuous maintenance and improvements. You can also count on us to keep an open ear to your requests.
To give you a better idea of how ohsome-py can be used for OSM data analysis, let’s walk through a practical example. Here, we’ll demonstrate how to aggregate and map specific OSM features, such as football pitches, in Berlin and London.
Example
A brief OSM data analysis with the help of ohsome-py might consist of an aggregation and mapping of a certain set of OSM features. In this example, we are analyzing how football pitches are mapped in OSM in Berlin and London. The source code is available in our git repository.
- Define Boundaries:
First, we identify the geographical boundaries of the two cities. These boundaries will be used to extract relevant data from OSM for Berlin and London. Note this is only an example, the bounding boxes are only chosen approximately. Though, the ohsome API also takes boundaries provided in a GeoJSON file as a filter.
- Define OSM Tags:
Football pitches in OSM are commonly tagged with leisure=pitch. To specifically filter for football (soccer) pitches, the tag sport=soccer is also used. Resources like taginfo.openstreetmap.org or the OSM-Wiki help identify these tags and their usage. This basic guide to OSM data filtering provides a good overview about the topic.
- Define time period:
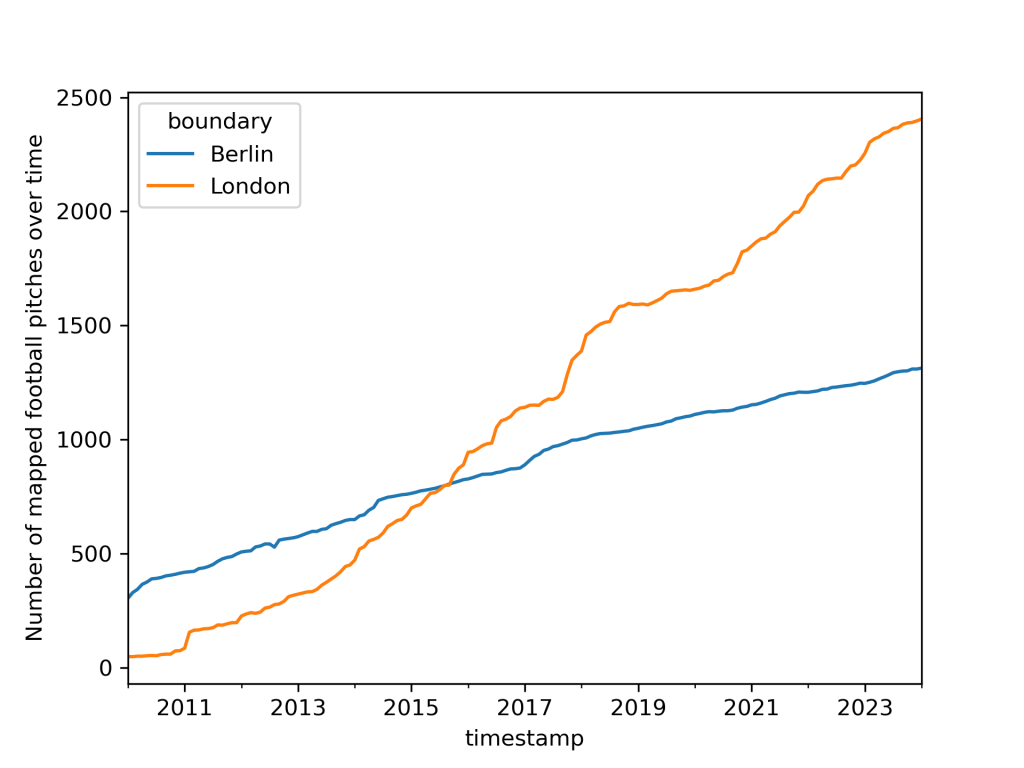
Using the identified tags leisure=pitch and sport=soccer, we gather data on the number of features mapped as football pitches within the bounding boxes of Berlin and London. In this query, we are also grouping by the boundaries.
The analysis spans from 2010 to 2024, providing insights into mapping trends over time. Data aggregation involves querying the OSM data via the ohsome API, specifically using the “elements aggregation” endpoint. This endpoint returns counts of features matching the given tags within the defined spatial and temporal parameters.
- Data extraction
Now we extract the data at the last available timestamp from OSM using the metadata endpoint of the ohsome API and plot the centroids of the extracted geometries.
*the example was created by Dominik Neumann.
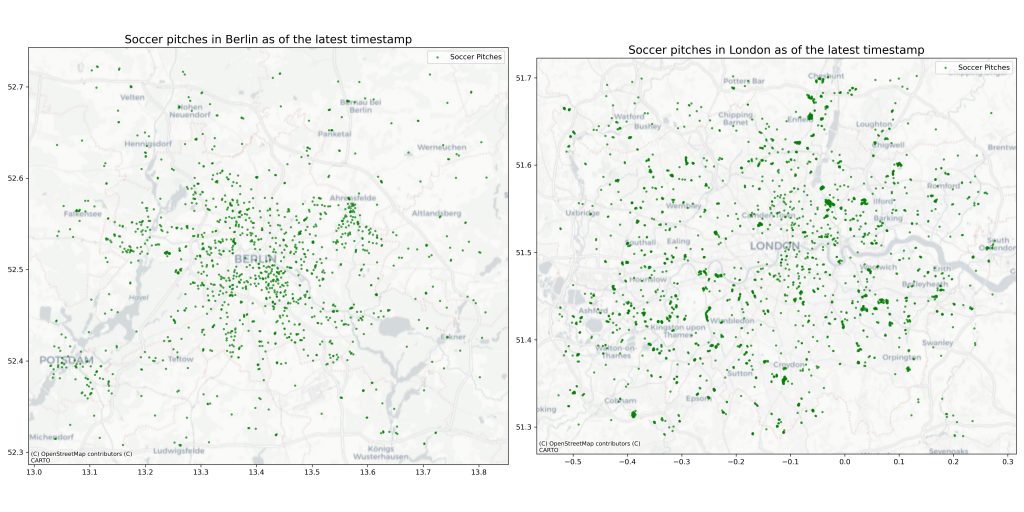
Given the extent of the area, the mapped geometries of the football pitches are hardly visible, hence the centroid calculation.
The functionality of ohsome-py provides a clear understanding of how OSM features, such as football pitches, are mapped and how they evolve over time across different spatial boundaries.undaries, possible.
For more detailed insights on how to use ohsome framework for your analyses, you can refer to the ohsome documentation and blog posts.
If you have any questions or suggestions for improvement, feel free to contact the ohsome team at ohsome@heigit.org or open a discussion in the GitHub repository.


