Welcome back to our blog post series ”ohsome Region of the Month” where you can find information on potential applications of the ohsome API. If you’re new to this format you can also read some of the former blog posts from this series which you can find here (about street networks), here (about railway networks) or here (about forests).
This month, we’ll look at another ”evolution-animation”. It deals with the development of mapped buildings in Nairobi (the capital of Kenya) in general and looks at how many of those buildings have additional information in form of the ”addr:city”-tag as a sort of indicator on how detailed the given information is.
Data
As usual, you can download your boundary data from this website. There were multiple requests sent to the ohsome API which you can find in a snippet as well as the boundary-GeoJSON file itself which you can conveniently download there, too.
Animation
Below you can see an animation of the evolution of buildings mapped in Nairobi between the years 2008-2021. The red buildings are the ones that have the additional ”addr:city”-information tagged.
You can find an example for the output in the snippet and even another one with instructions on how you can create an animation like this one yourself.

The very first building in Nairobi was mapped in September 2008. About a week later, more buildings joined in. After these first regional mapping activities not much happened until about December 2009, an occurrence that might be linked to an import of Map Kibera data between November 2009 and January 2010. Furthermore, one can observe a more frequent mapping activity, especially in terms of new added areas, from that point onwards. A period of very high mapping activity can be found during the second half of 2011, for which unfortunately no potential explanation could be found. The first buildings that actually have the additional ”addr:city”-information added occur in December 2012, which could be motivated by an increase in coverage of Bing-Aerial Images for Nairobi in April 2012. However, the progress remains rather small until spring 2016 when bigger parts start getting added. A trend which only continues in the following year around the time when the Youth Mappers launched at Kenyan Universities.
Density
Below is a graphic of density-development of buildings in Nairobi over the years:
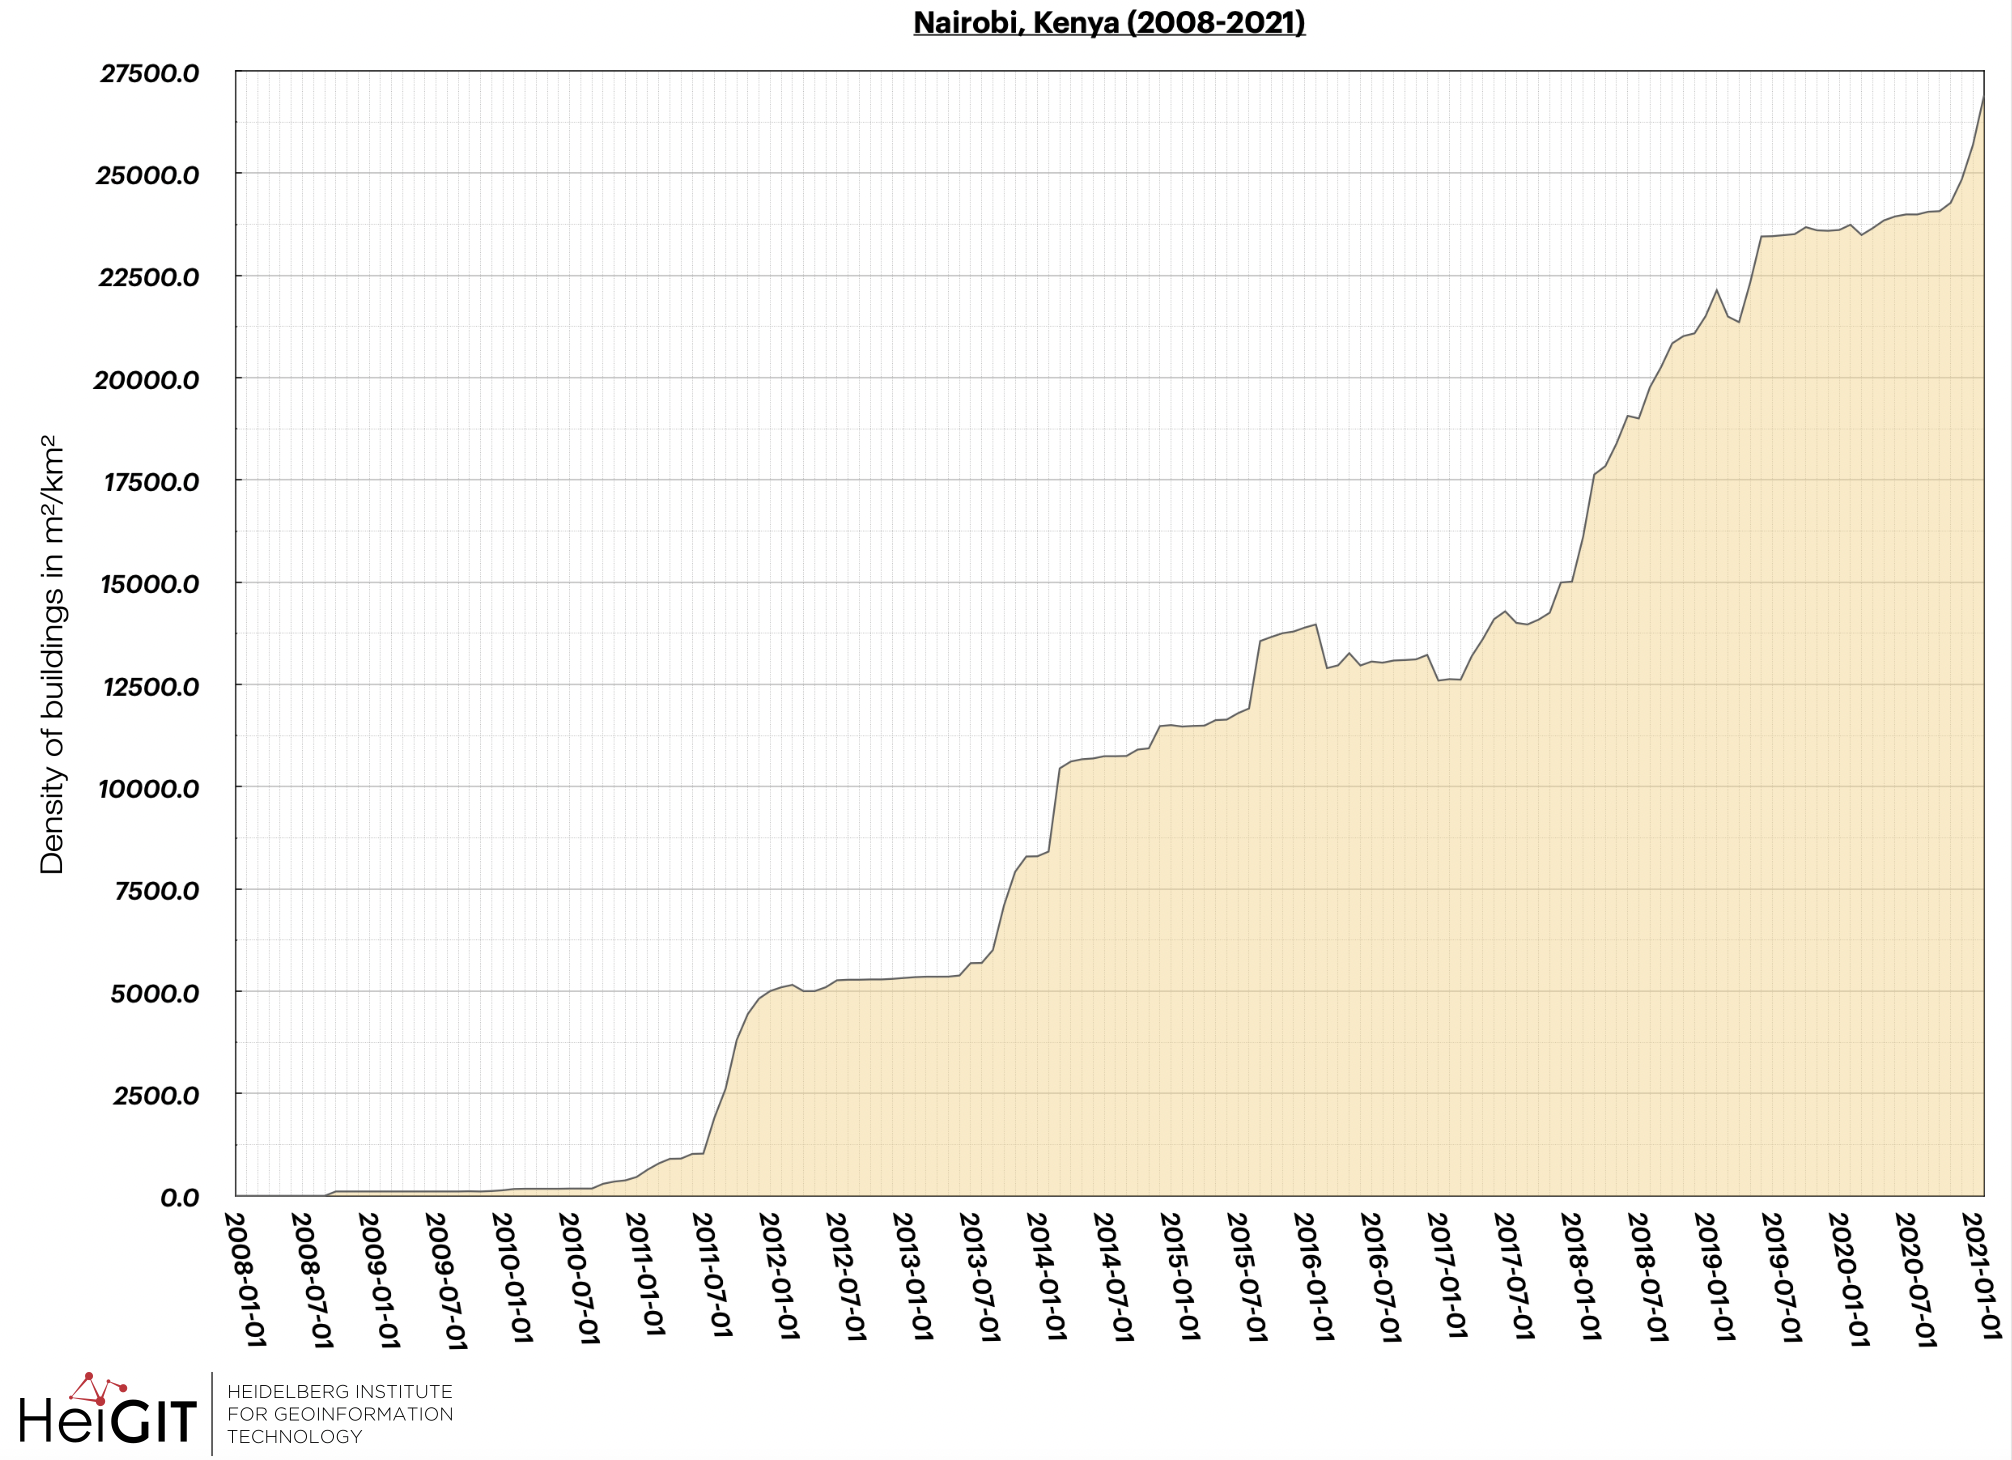
In accord with the animation there is no notable density-development until about later 2008 whatsoever. After that, one can observe an overall increasing trend, which again might be related to activities, of the Map Kibera Trust with stronger jumps in density between July and August of 2011, which was already displayed in the animation too, in September 2013, as well as in January 2018 from which the latter values show a stronger increasing tendency. A Mapathon in connection to the 7th International Open Data Day took place in March 2018 and could be a potential reason for the higher values around that time either.
Users
Here you can see the monthly user-counts of the building-tag for Nairobi over the years with the average being 12 users/month:
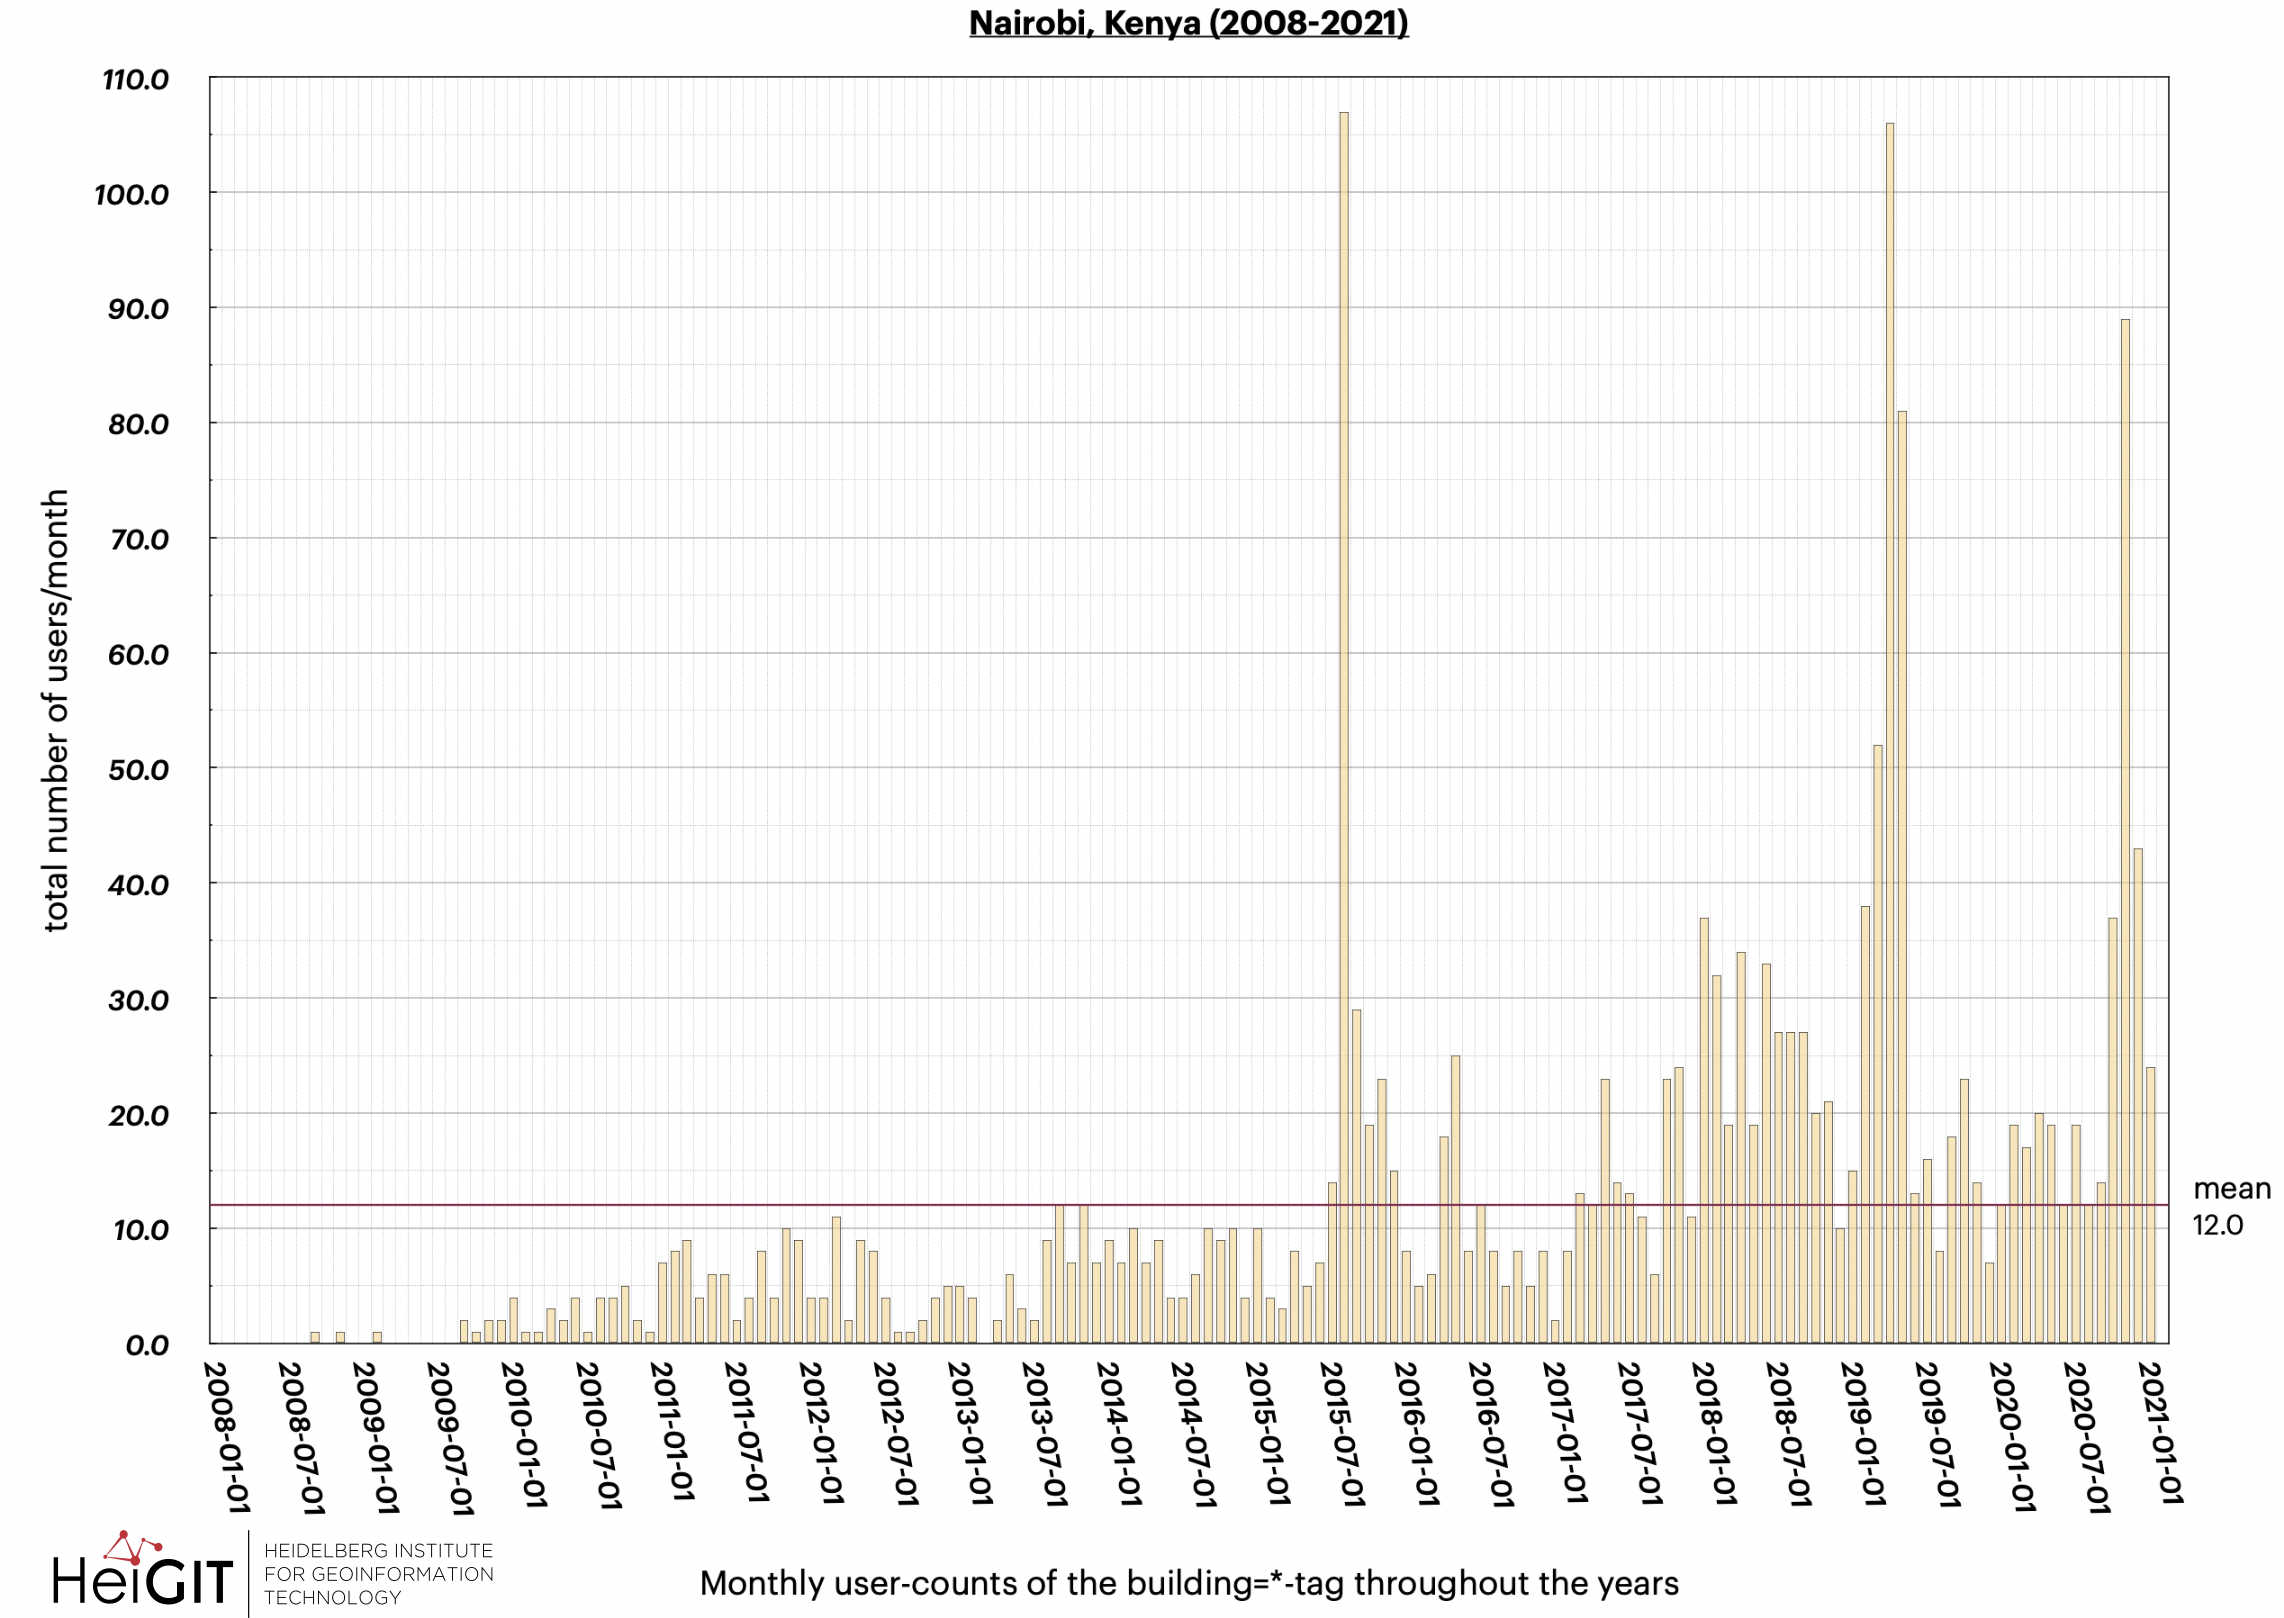
As well as in the graphic for density, one can see an overall positive trend in users interacting with the building-tag in Nairobi, yet the main developments striking the eye of the observer would be three distinct peaks in user-counts. One is in August 2015, the second in 2019 and the third and last in November 2020. For the first, unfortunately no potential explanation could be found, although mapathons within the local community might be an explanation. The second might be related to an Open Data Mapathon that took place at the beginning of March 2019 and could therefore be responsible for the higher numbers until the first of April 2019. Starting in October 2020 the Youth Mappers Kenya have made an effort trying to map Kenyan Health facilities, so there could be a slight, although temporarily delayed, connection. Furthermore, the graphic shows a period where there has been well above average user-activity between January 2018 until October 2018. These relatively high numbers might be related to the attempt of mapping Nairobi’s Slums for better healthcare or to the Open Data Day Mapathon that was mentioned earlier.
Ratio
This last graphic shows you the ratio of those buildings, that have the additional ”addr:city” information given to the total of building=*-objects:
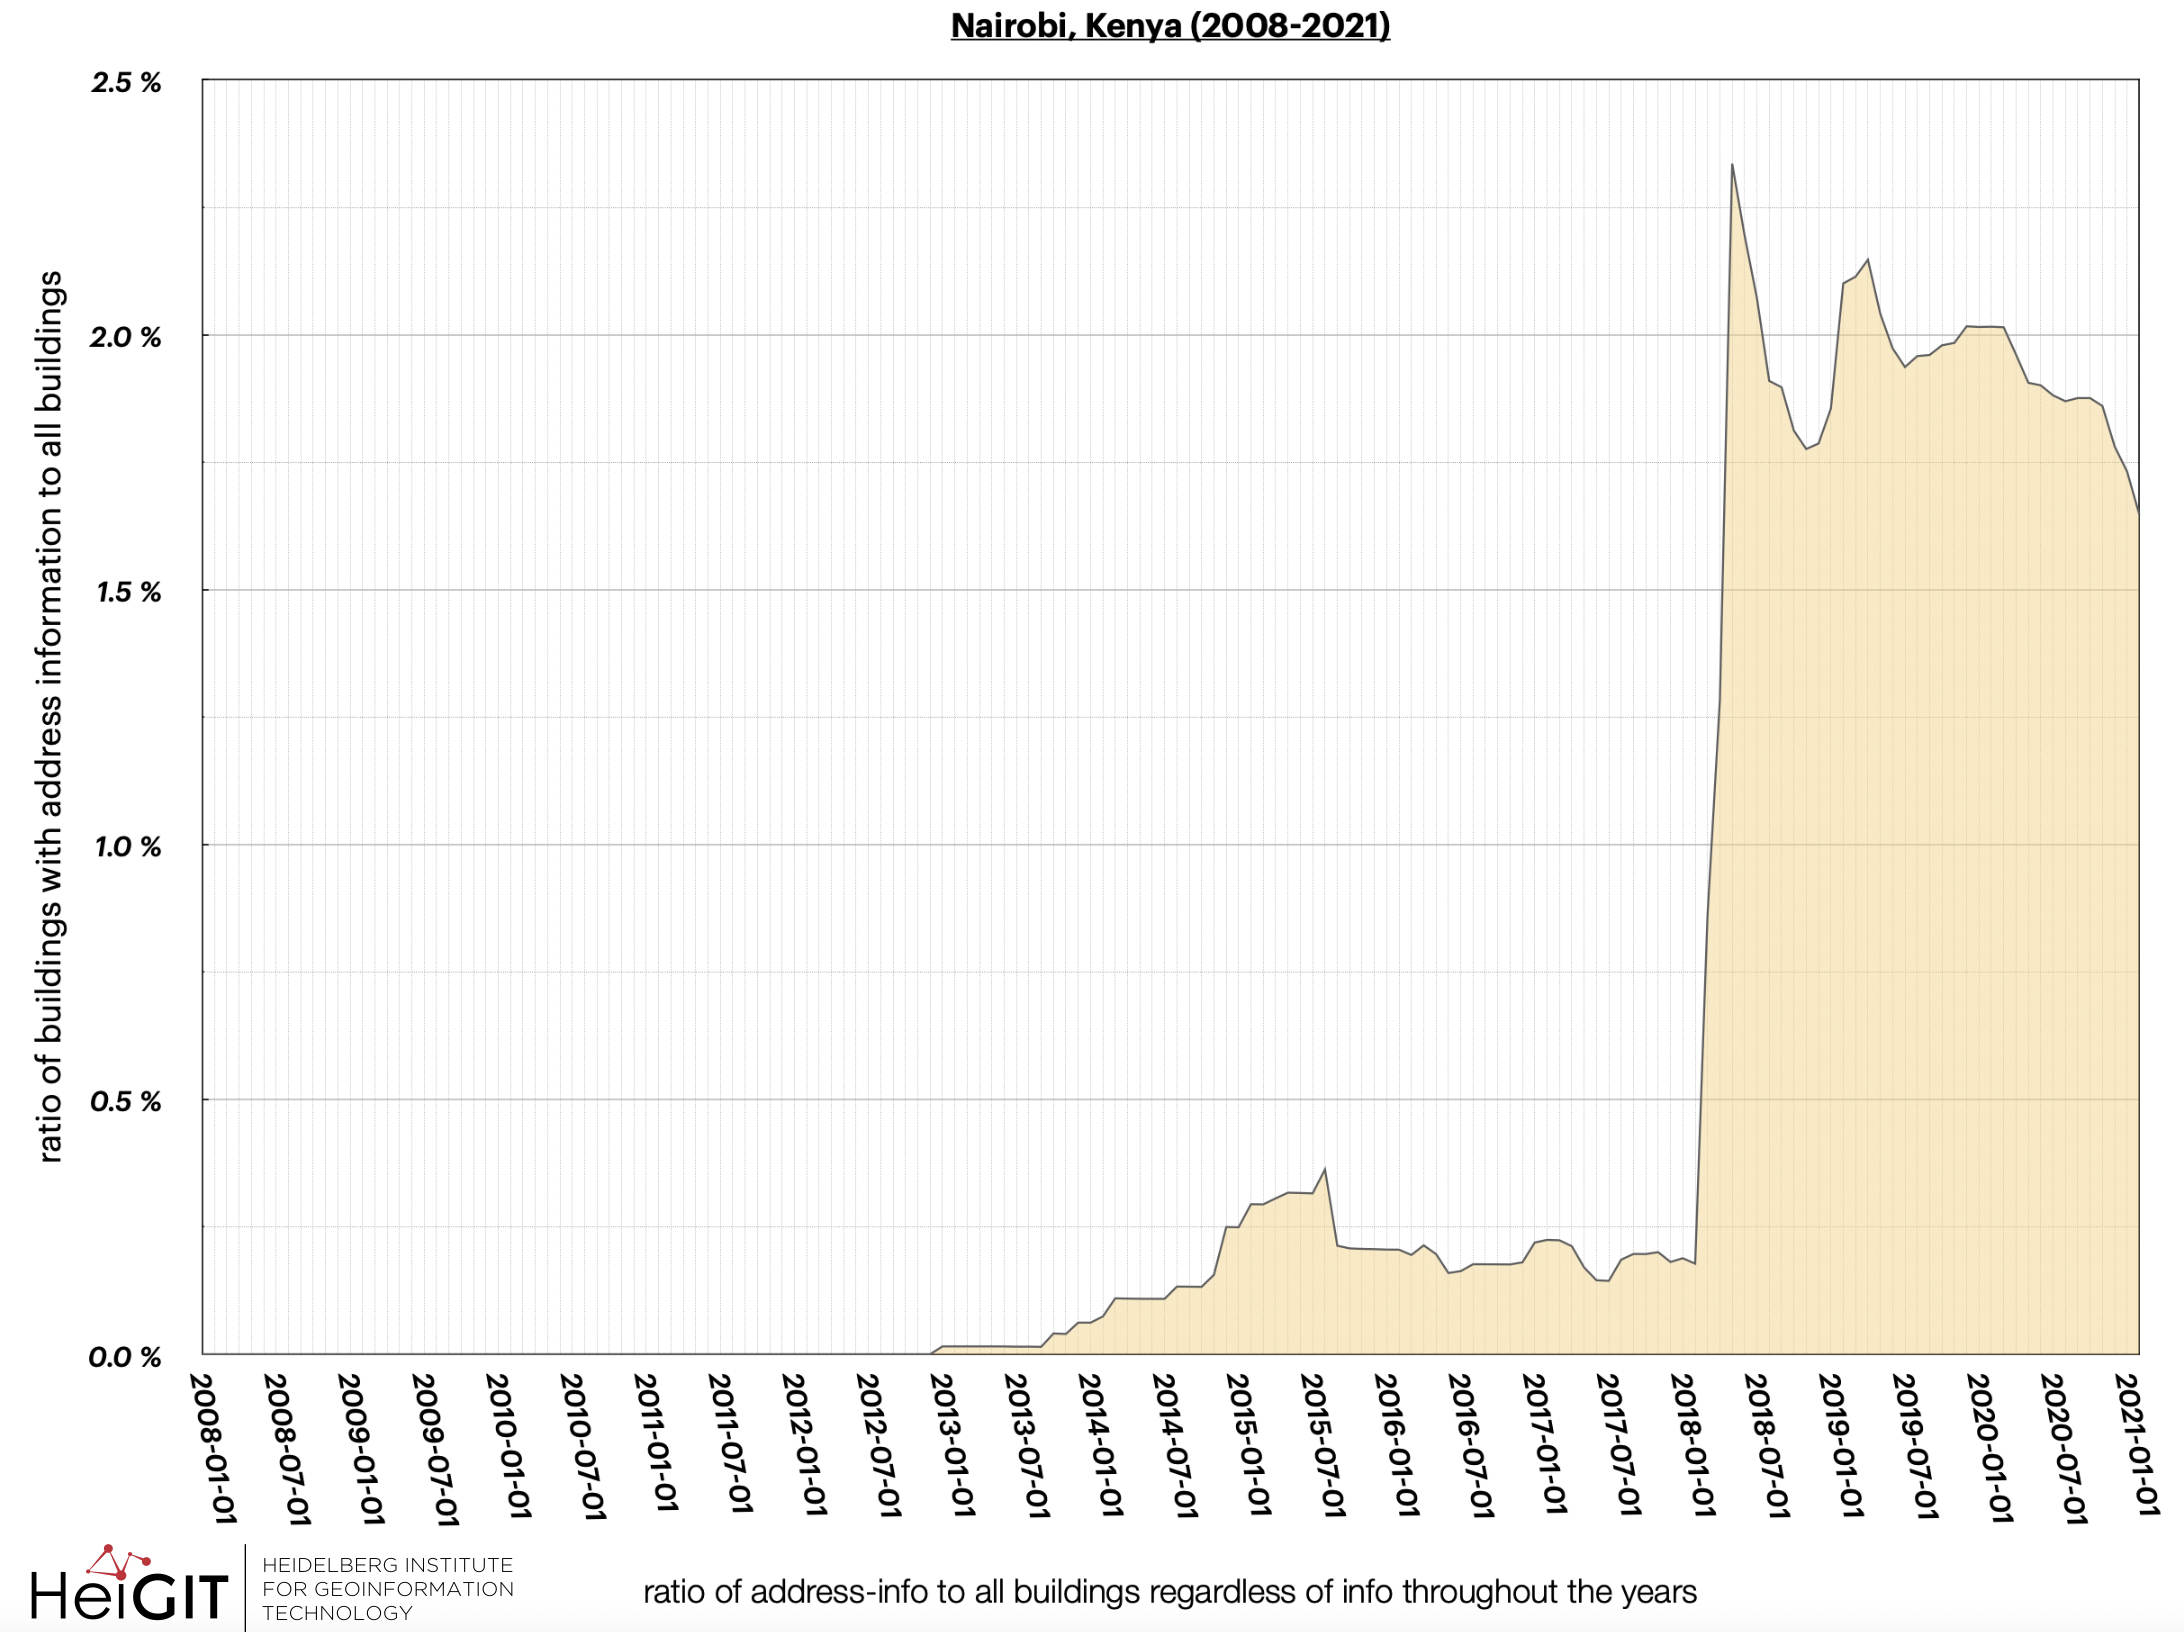
Unlike displayed in the other graphics, one can see that there has not been any buildings with the additional ”addr:city”-information until December 2012, therefore there is no ratio-data for the time span of about 5 years available. Since the progress remains quite small (see animation) until early 2016, a potential reason for the development might be an individual effort or smaller local projects, but that is of course only an assumption. The values are generally pretty low yet they do show a positive trend with an exceptionally strong increase in May 2018. After that, one can observe another slight decrease again which itself might be related to the strong increase of overall building-density during that time.
We can conclude that Nairobi has come a long way and can show a very positive development over the years when it comes to OpenStreetMap-data coverage. When looking at the trends of the different graphics and the apparently high activity of the local mapping community, one can assume that there will be more and further detailed mapping going on in the future.
Thanks for reading this month’s blog post on our Region of the Month Nairobi, Kenya. Stay tuned for more blog posts in the coming months!
Background info: the aim of the ohsome OpenStreetMap History Data Analytics Platform is to make OpenStreetMap’s full-history data more easily accessible for various kinds of OSM data analytics tasks, such as data quality analysis, on a regional, country-wide, or global scale. The ohsome API is one of its components, providing free and easy access to some of the functionalities of the ohsome platform via HTTP requests. Some intro can be found here:
-
ohsome general idea
-
ohsome general architecture
-
how to become ohsome blog series
-
how spatial joins queries work in the OpenStreetMap History Database OSHDB