Last week, the annual conference FOSS4G (Free and Open Source Software for Geospatial) has been taken place online. The conference is organized by The Open Source Geospatial Foundation (OSGeo) and attracts over 1000 developers, users, decision-makers and observers from a broad spectrum of organizations and fields of operation each year. HeiGIT and MapAction contributed a talk about “Using the ohsome framework to develop an OSM Confidence Index to support humanitarian mapping”. The talk presented how HeiGIT and MapAction are addressing OpenStreetMap data quality questions with the open source ohsome platform to perform in depth data analysis of spatio-temporal statistics of the OSM geo data set. We’ve uploaded the slides for you: foss4g-osm-data-quality
OSM data is used more and more widely, which means that data quality and fitness-for-purpose analyses are becoming more and more relevant. Many scientific papers have been written about OSM data quality, but most only apply methods to few small regions, and results are available for the single point in time when the papers are published. Results are often not easy to replicate, e.g. to check the transferability of a method to other regions. Ideally, one would like to calculate data quality measures on a global context in a fine spatial (and temporal) resolution. Alongside the OSM community, the users of OSM data are manifold: from academics to businesses and humanitarian actors. The OSM community has over 1 million active contributors, around 50,000 of which are active each month. Four out of the “big five” mega-corporations are already using OSM data in their products and are actively contributing to the OSM data set.
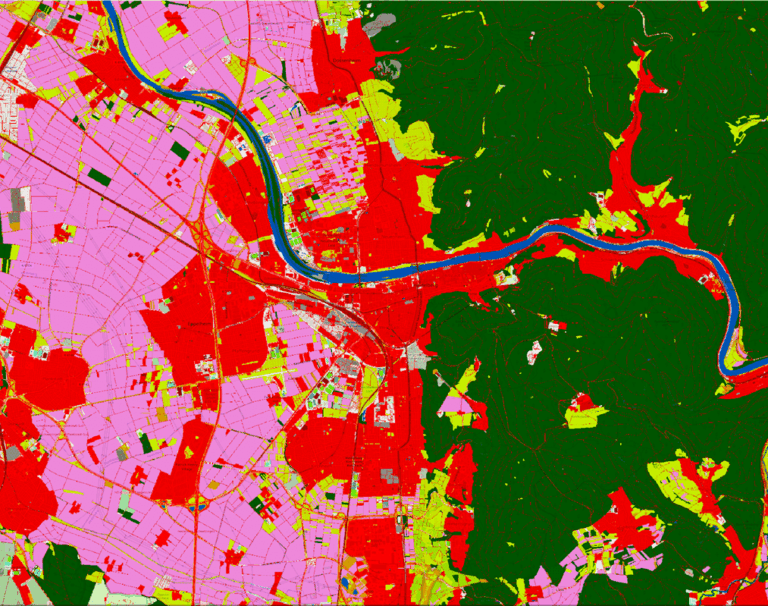
Just recently we have released a new version of the ohsome quality analyst (OQT) (0.6.0). New features include new API-endpoints to list available indicators, reports, layers, datasets and feature id fields and the usage of pydantic data models to validate API requests. Please have a look at the CHANGELOG for a more detailed list of changes. The maps below show quality estimations in respect to the completeness of buildings and the currentness of roads in OSM. These have been generated using the command line interface of OQT (stay tuned for a future blog post providing more hands-on examples on how to use OQT locally on your computer). Please note that we are still experimenting with adjusting the threshold functions used to distinguish the three data quality levels. Nevertheless, the maps can provide a first quick overview on where mapping in OSM has been done already, and for which areas more mapping might be needed.
As always we welcome your suggestions and contributions to improve maps such as these.
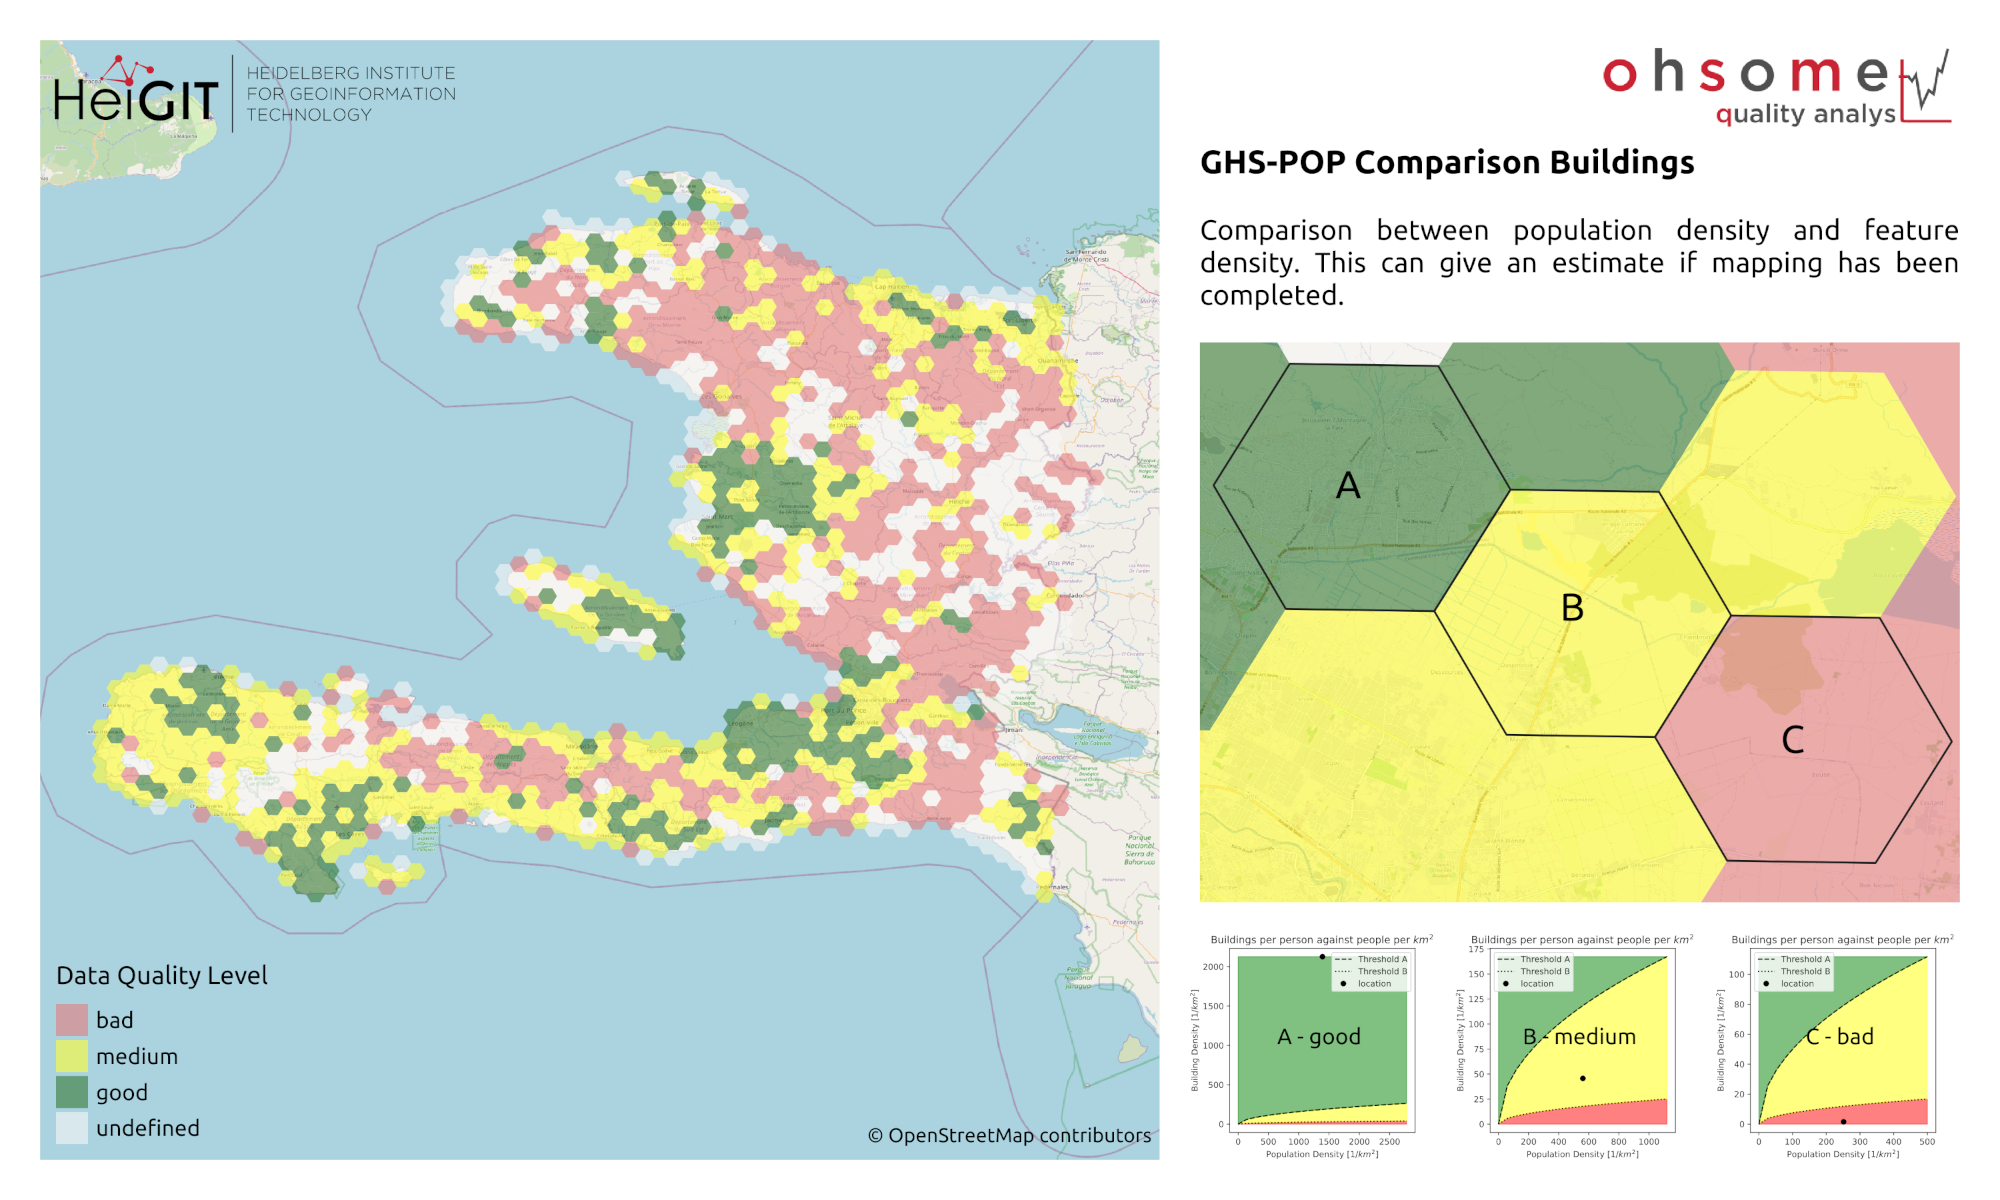
Figure 1: OSM building completeness in Haiti based on a comparison to the Global Human Settlement Layer population
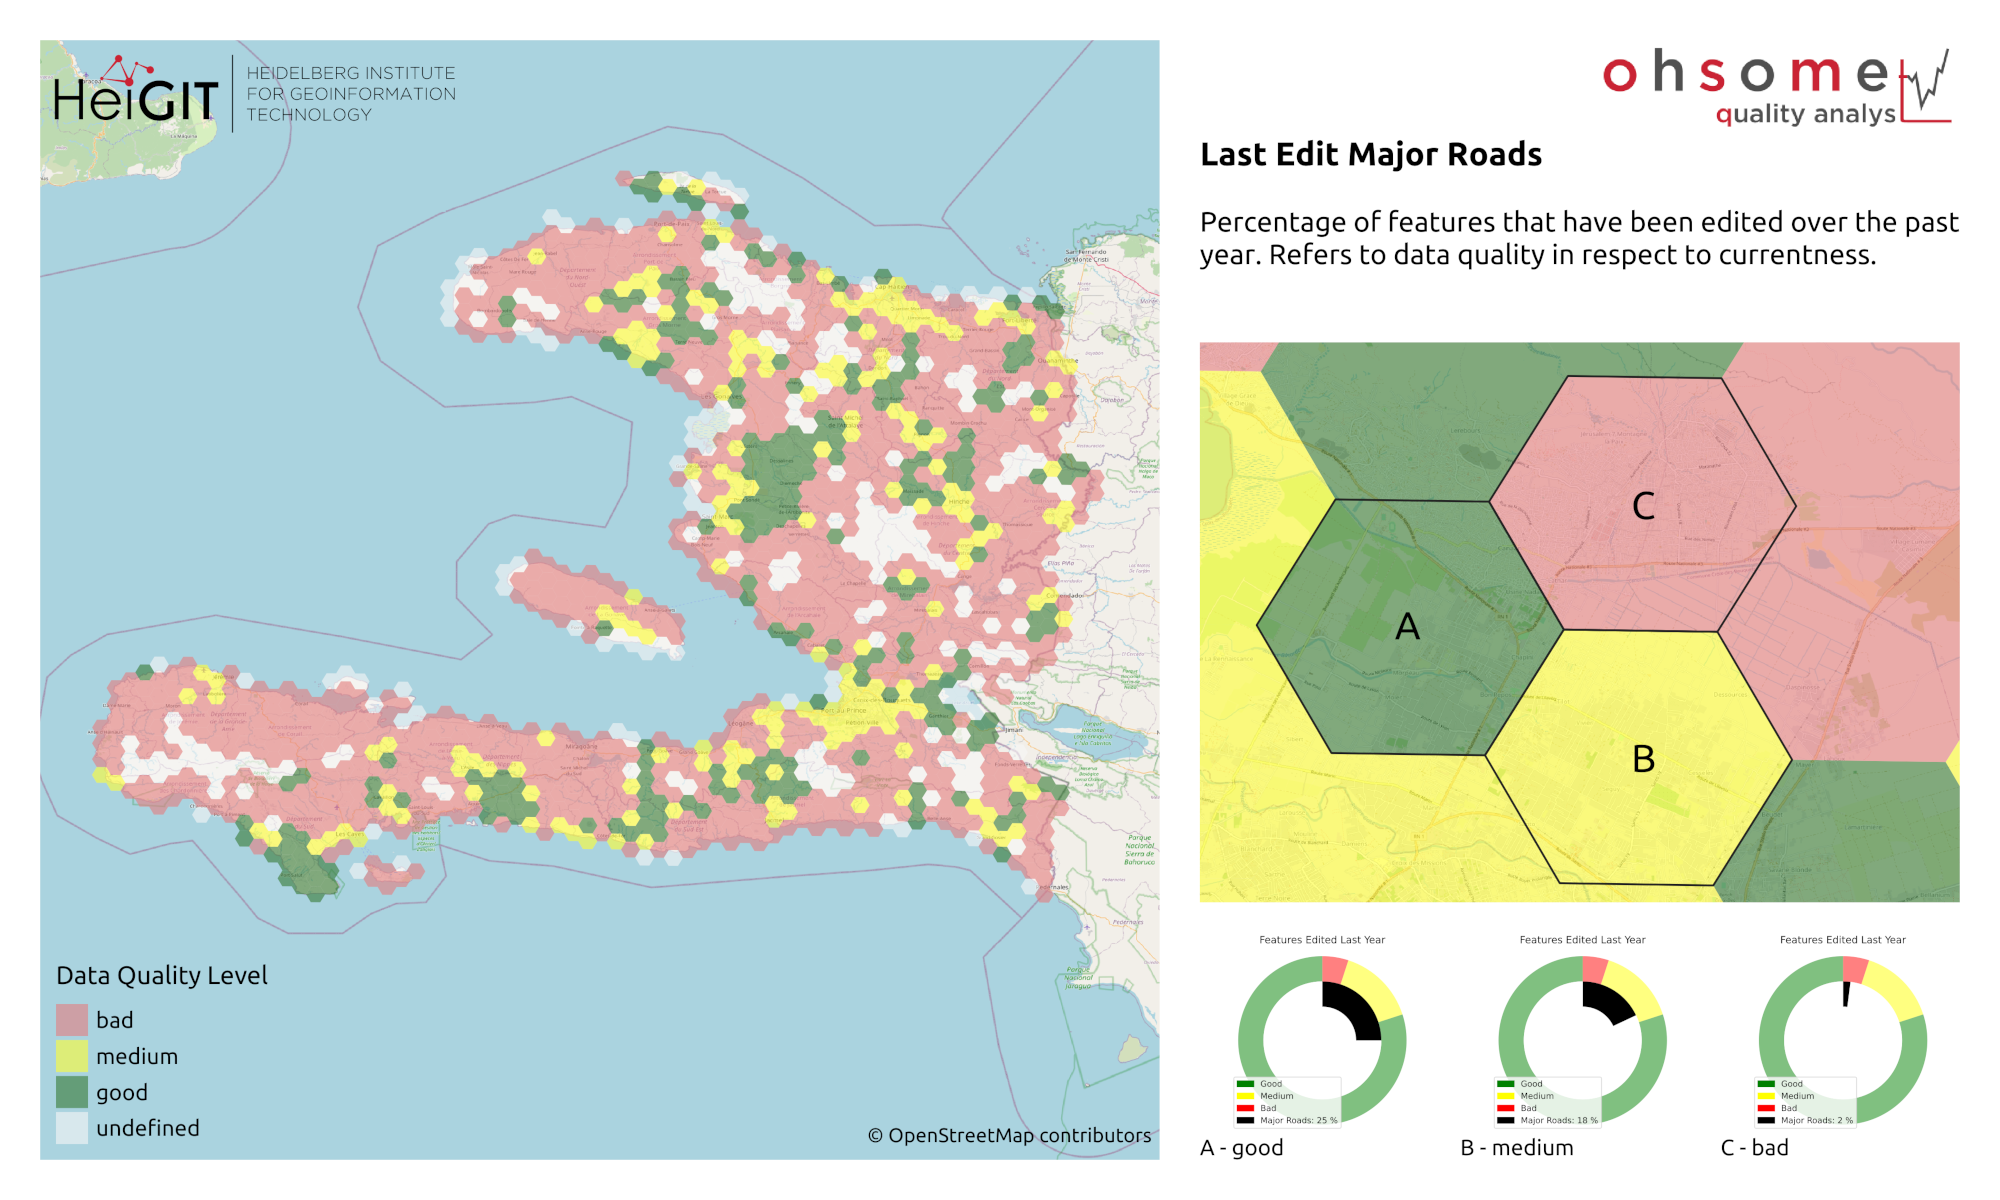
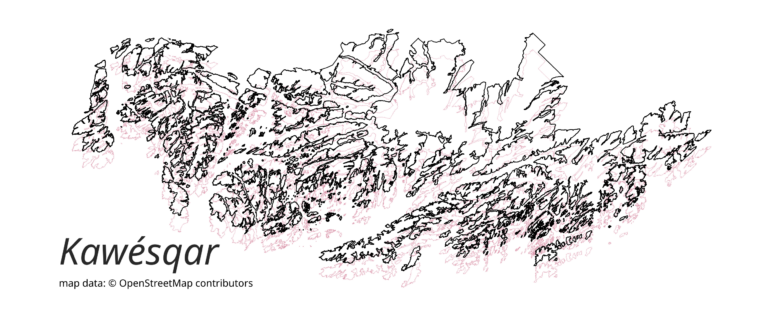
Figure 2: Currentness of OSM roads in Haiti. This is an intrinsic quality indicator taking into account the share of features edited over the past year.
Related work:
OQT relies on information from the OpenStreetMap (OSM) that has been processed using the ohsome OSM History Data Analytics Platform developed by HeiGIT. The aim of the ohsome framework is to make OpenStreetMap’s full-history data more easily accessible for various kinds of OSM data analytics tasks, such as data quality analysis, on a regional, country-wide, or global scale. Here you find a list of related blog posts and publications:
Blogposts
- Introducing the ohsome quality analyst (OQT)
- Behind the scenes of the ohsome quality analyst (OQT)
- The ohsome quality analyst goes public on Github with new release 0.3.0
- ohsome general idea
- ohsome general architecture
- how to become ohsome blog series
- Workshop about ohsome framework at Foss4G 2019
Publications
- Raifer, Martin; Troilo, Rafael; Kowatsch, Fabian; Auer, Michael; Loos, Lukas; Marx, Sabrina; Przybill, Katharina; Fendrich, Sascha; Mocnik, Franz-Benjamin; Zipf, Alexander (2019): OSHDB: a framework for spatio-temporal analysis of OpenStreetMap history data. Open Geospatial Data, Software and Standards.
- Herfort, B., Lautenbach, S., Porto de Albuquerque, J., Anderson, J., Zipf, A.The evolution of humanitarian mapping within the OpenStreetMap community. Scientific Reports 11, 3037 (2021). DOI: 10.1038/s41598-021-82404-z https://www.nature.com/articles/s41598-021-82404-z
- Schott, M.; Grinberger, A. Y.; Lautenbach, S. & Zipf, A. (2021) The Impact of Community Happenings in OpenStreetMap – Establishing a Framework for Online Community Member Activity Analyses In: ISPRS Int. J. Geo-Inf. 10, no. 3: 164. https://doi.org/10.3390/ijgi10030164
- Grinberger, AY, Schott, M, Raifer, M, Zipf, A. (2021): An analysis of the spatial and temporal distribution of large‐scale data production events in OpenStreetMap. Transactions in GIS. 2021; 00: 1– 20. https://doi.org/10.1111/tgis.12746