The open, flexible and collaborative nature as well as the benefits and advantages of OpenStreetMap (OSM) lead to the creation of a whole new ecosystem evolving around the project. They range from local and global communities of data and software developers to a large amount of tools and services like disaster response, routing, art etc. This ecosystem has one thing in common: each member needs to interact with the data from the central OSM database.
Over the years a large number of tools emerged to accomplish this task, each of which has its personal strengths and weaknesses. Some are limited to certain use cases or data sizes, some are highly complex and for specialist only, and some were abandoned and are no longer maintained. To find out which tool is suitable in which situation can be a time consuming task.
In 2017 HeiGIT created yet a new set of tools to work with OSM data that fills a gap especially in the big data domain. Since then the ohsome framework has matured and is now well established within the OSM ecosystem being used by professionals, researchers and the general public. For example at the State of the Map 2020 conference (the global OSM conference) a considerable number of presentations on the academic track directly made use of these tools to create new knowledge about the project as a whole and the services welcome more and more users every month.
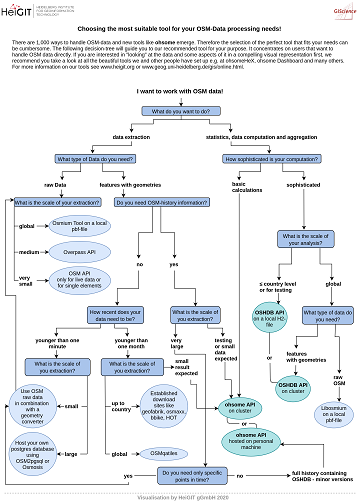
If you now think of switching to this new and innovative set of applications that are easy to use and actively developed but are not quite sure if they are suited for your use case, we have created a simple decision tree to support you! If you are new to the world of OSM data then this decision tree might help to get you started quickly and try out the right tools by answering a few simple questions on your use case.
Of course choosing the right tools also highly depends on personal preferences. Yet the following diagram indicates where we see our tools best suited, listing alternatives where they are not (yet) fully suitable. But no matter your OSM knowledge, your data usage frequencies or your programming skills: One ohsome tool shall be suited for your needs!
Please find here a pdf version of the chart including direct links to the mentioned ohsome tools.
Further readings:
- How to become ohsome blog series
- Scientific article on OSHDB
- OSHDB and ohsome API git repositories
- For some amazing work that has been accomplished using this framework see for example our ohsome Analyses for HOT Tasking Manager Projects or Yair Grinbergers SOTM talk on Analyzing the spatio-temporal patterns and impacts of large-scale data production events in OpenStreetMap ( Grinberger , Y., Schott, M., Raifer, M., Troilo, R. Zipf, A. (2019). Analyzing the spatio-temporal patterns and impacts of large-scale data production events in OpenStreetMap In: Minghini, M., Grinberger, A.Y., Juhász, L., Yeboah, G., Mooney, P. (Eds.). Proceedings of the Academic Track at the State of the Map 2019, 9-10. Heidelberg.)

