This study evaluates the applicability of macro-scale energy poverty indices in an urban context, using Santiago de Chile as a case study.
Energy poverty (EP), understood as the inability of a household to meet its basic energy needs, is a global challenge exacerbated by rising energy prices, inflation, and economic instability. Accelerated urbanization and climate change are intensifying this issue; by 2050, when seven out of ten people will live in cities, the absence of measurement and mitigation strategies at this scale will deepen inequalities and perpetuate invisible energy vulnerabilities.
Current approaches to measuring EP are typically divided into unidimensional indices—focused mainly on economic metrics such as household income and energy expenditure—and multidimensional indices, which also account for housing quality, thermal comfort, and the affordability of energy sources. While multidimensional indices provide a broader perspective, both types have largely been designed for macro-scale, country-level assessments. This national-scale orientation overlooks the reality that most people live in cities, where EP is shaped by highly localized conditions. Urban areas exhibit sharp spatial contrasts in climate, income distribution, and housing characteristics, creating complex and uneven patterns of energy vulnerability. Applying macro-scale indices directly to cities risks masking these intra-urban disparities, limiting their usefulness for identifying high-risk neighborhoods or evaluating targeted local policies.
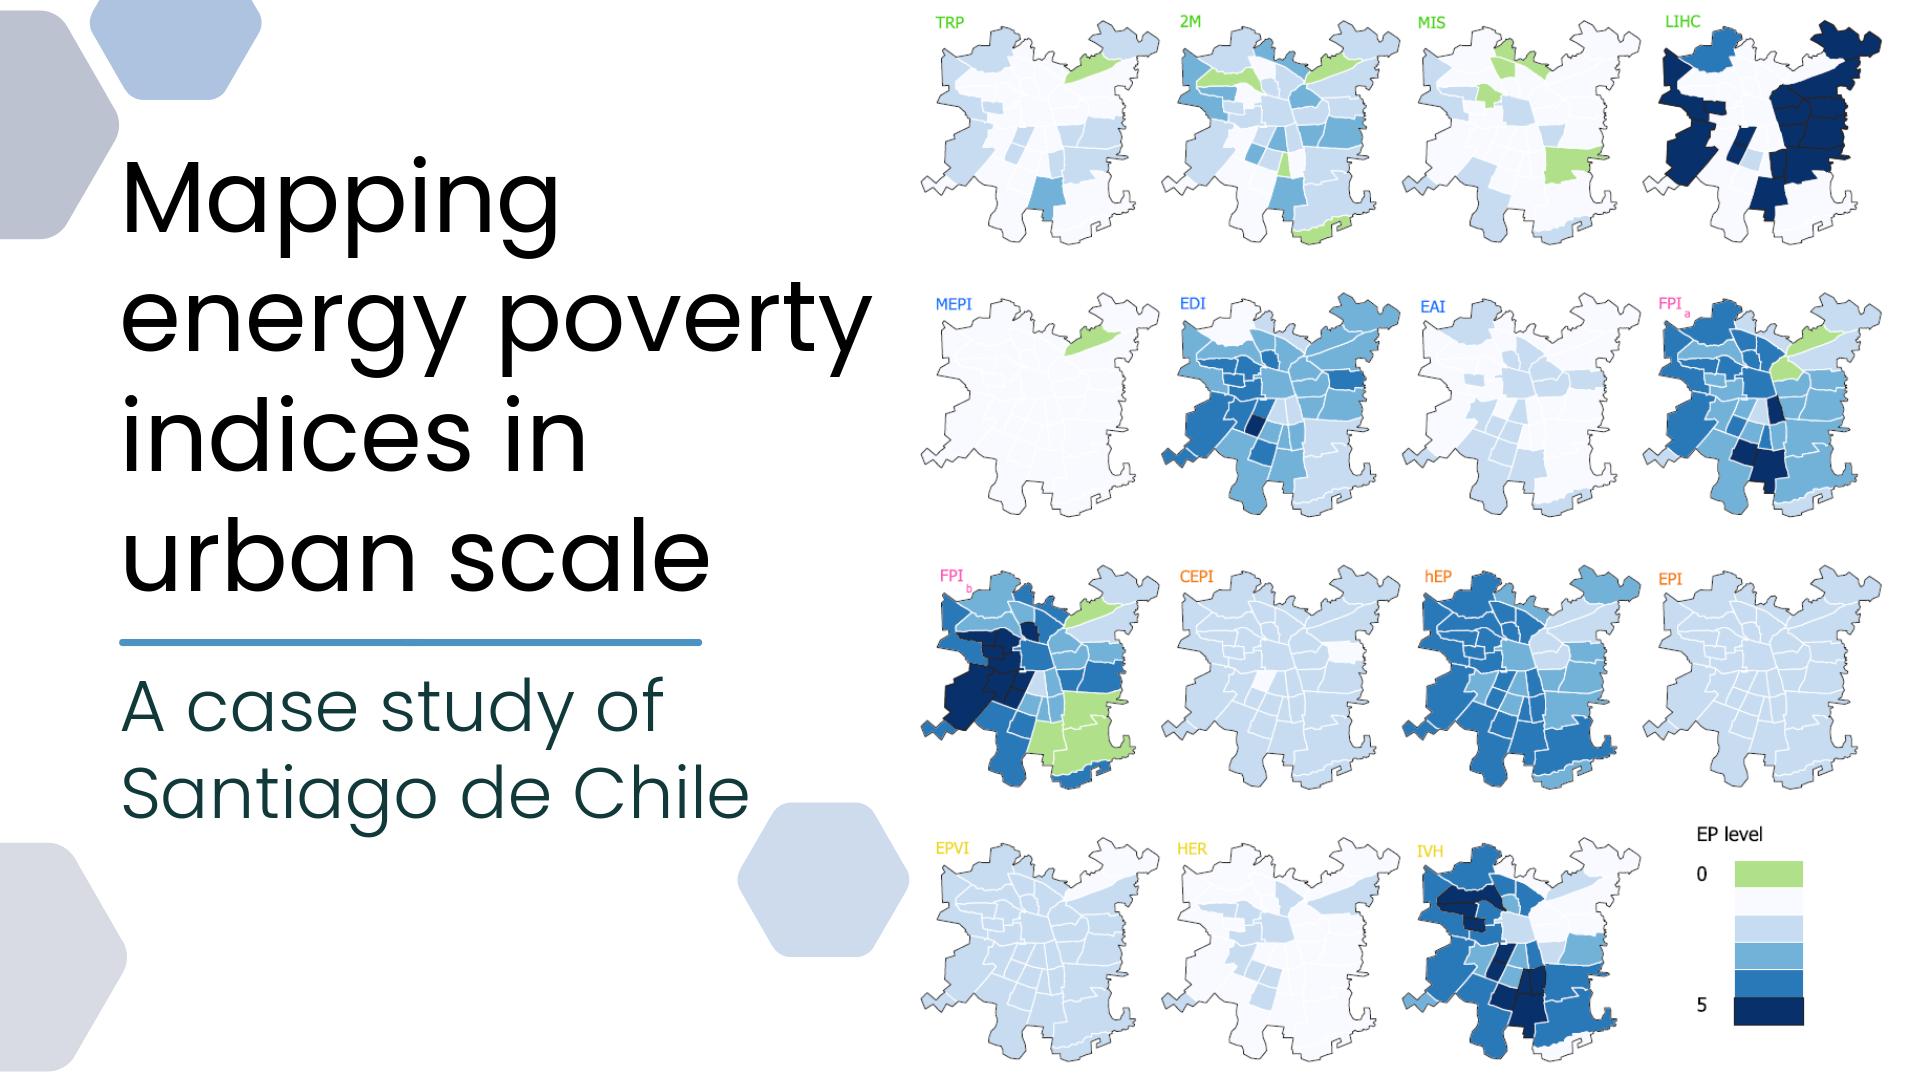
To address this gap, this study assesses the applicability of existing EP indices in an urban context, using Santiago de Chile as a case study. The methodological approach combines quantitative and geospatial techniques in three phases: first, a literature review identifies and selects relevant indices that, although originally developed for macro scales, have the potential to be adapted to finer spatial contexts. Second, these indices are classified and adjusted to incorporate Santiago’s urban specificities, including climate variability, income distribution, and housing characteristics. Finally, the results are mapped in QGIS to visualize the spatial distribution of EP and detect localized vulnerability patterns.
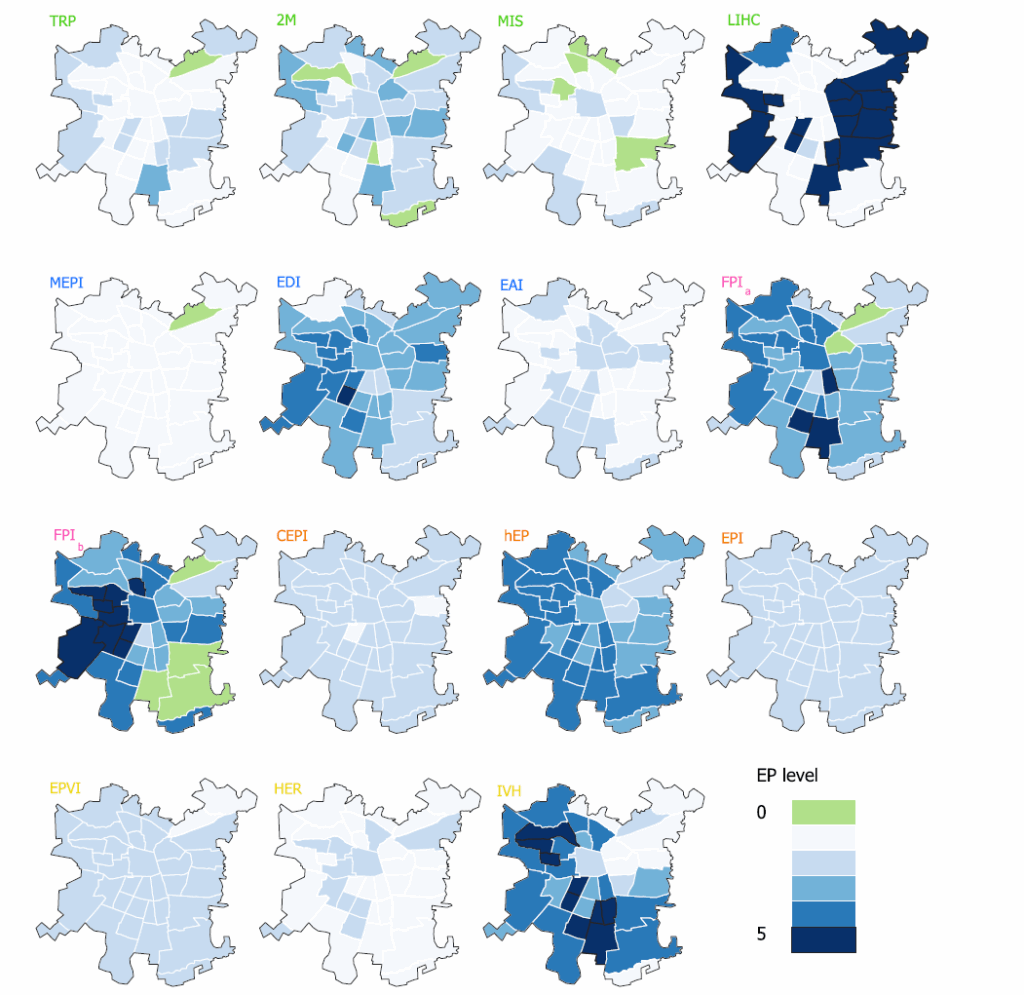
The comparative analysis revealed striking contrasts: average EP scores ranged from 1.2 (HER) to 4.7 (EPI), demonstrating that the choice of index can completely alter the territorial diagnosis. This finding underscores that measuring EP is not merely a technical exercise, but a strategic decision with direct implications for where and how interventions are implemented. The classification of communes revealed persistent patterns: Lo Prado, Lo Espejo, and Cerro Navia consistently emerged as high-vulnerability areas, highlighting chronic urban hotspots regardless of the calculation method. In contrast, communes such as Providencia and La Pintana maintained stable positions, albeit driven by opposing structural conditions—emphasizing the importance of contextual interpretation. A critical finding was that most indices fail to incorporate policy-sensitive variables, missing the opportunity to directly link measurement with action. Incorporating proportional stratification, dimensional triangulation, and urban-specific adaptations significantly increased the precision and relevance of the assessment, paving the way for hybrid frameworks that integrate geospatial analysis, real-time monitoring, and dynamic thresholds to anticipate and respond to the evolving nature of urban energy vulnerability.
Reference: Martínez-Soto, A., Sanhueza-Catalán, D., Uribe-Vargas, T., Lehmann, R., Zipf, A., Sierra-Varela, L., Nix, E., & Oyarzún, T. (2025). Mapping energy poverty indices in urban scale: A case study of Santiago de Chile. Energy Research & Social Science, 127, 104242. https://doi.org/10.1016/j.erss.2025.104242