From assessing CO2 emissions from residential heating to urban active mobility infrastructure, the Climate Action Navigator helps identify where targeted action is most urgently needed to counteract climate change.
The Traffic Emissions tool estimates road transport-related CO₂ emissions at street and district level. With this resolution, users can identify which places are most impacted by traffic emissions and therefore propose targeted policy or behavioral changes, such as car-free areas or speed limit reductions.
The Traffic Emissions Assessment Tool
Emissions from transport, most of which come from road traffic, account for about a quarter of the EU’s CO₂ emissions. Detailed, high-resolution emission maps are fundamental to accurately track reductions in traffic emissions.
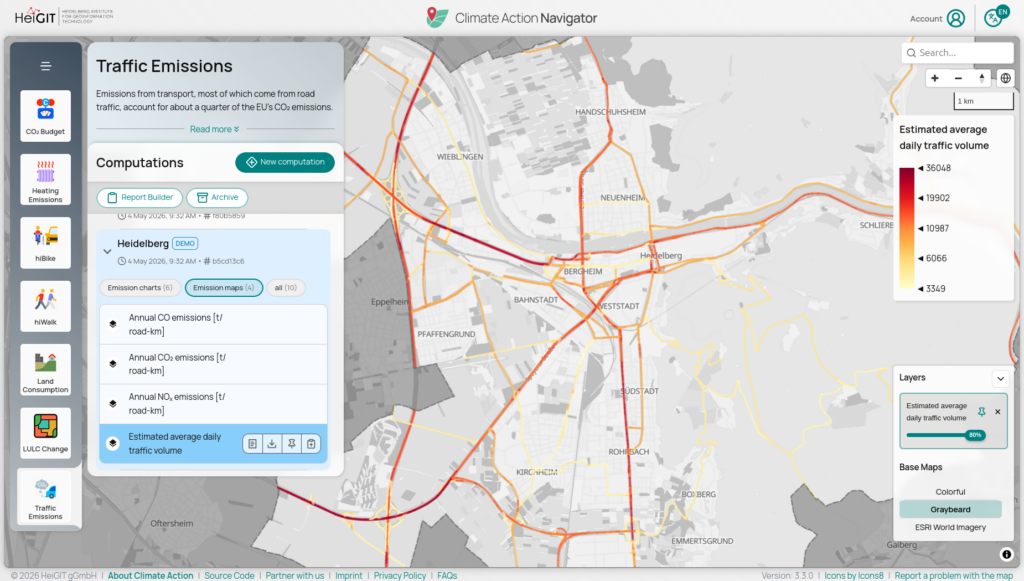
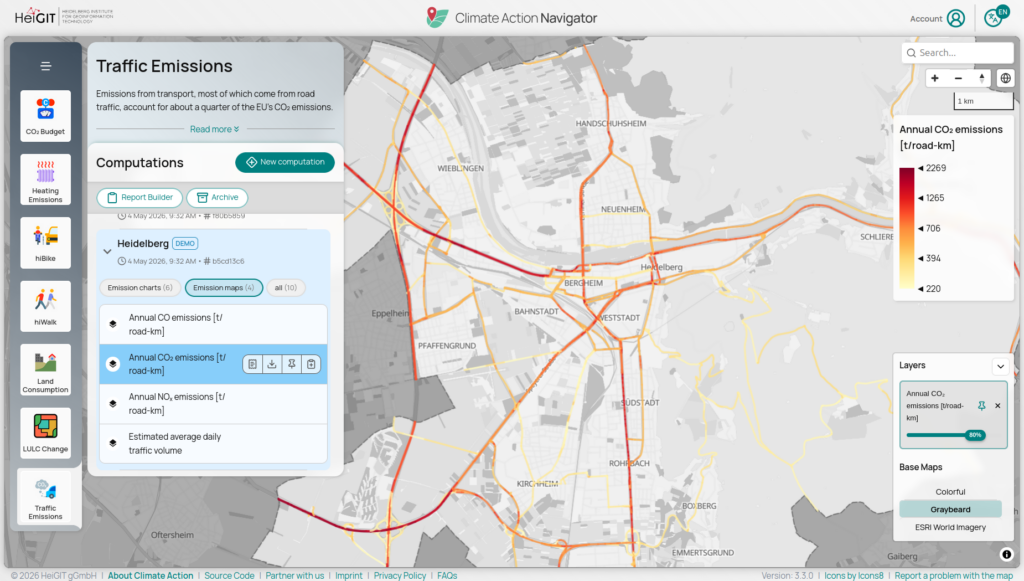
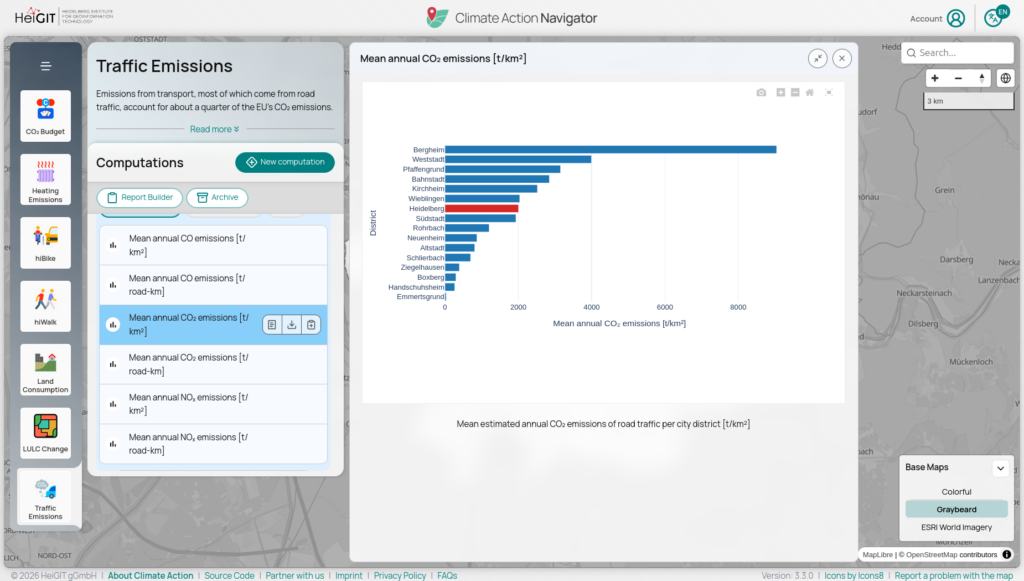
The Traffic Emissions assessment tool generates maps showing traffic volume as well as CO2 emissions and emissions of the pollutants CO and NOx per road segment. It also produces charts showing the mean emissions per road kilometer and per square kilometer for each district of the selected city.
Traffic emissions maps can be produced for any area within Germany. For instance, below you can see the average daily traffic volume and the annual CO2 emissions for the city of Heidelberg.
These maps can be used to simulate the effects of household behavior or policy changes such as car-free areas or reduced speed limits, as well as to provide localized data that supports communication and monitoring of climate actions, helping to encourage behavioral and policy shifts.
How We Calculate Traffic Emissions
The traffic emissions maps and charts are based on estimations of daily traffic volume and of the related emissions, which are calculated as follows:
First, we estimate how many vehicles travel on each road segment per day. This is called the average daily traffic volume (ADTV). To do this, we trained a machine-learning model using real traffic count data from the German federal states of Berlin and North Rhine-Westphalia. The model then uses this data to predict traffic volumes across all of Germany.
For its predictions, the model relies on road network data from OpenStreetMap (road type, number of lanes, and speed limits) as well as the average population density within a 10 km area around each road segment.
The model is based on a method called gradient boosting regression and was tested using a standard validation approach (10-fold cross-validation, with 80% of the data used for training and 20% for validation). It achieved a level of accuracy (R²) of 0.67, with an average error of about 3,931 vehicles per day. Minor roads, such as residential streets, were not included because there is little traffic data available for them. While this is a limitation, it simplifies the model and has only a minor effect on the results, since most traffic occurs on major roads.
In the second step, we estimate emissions of carbon dioxide (CO₂), carbon monoxide (CO), and nitrogen oxides (NOₓ). For each road segment, emissions are calculated by combining the estimated traffic volume with fuel consumption and emission factors.
Fuel consumption is calculated based on vehicle type (such as cars, trucks, or motorcycles) and driving speed. It is calculated using formulas from Sobrino et al. (2014). The share of different vehicle types is based on their proportion in Germany’s overall vehicle market shares.
When speed limit data is available in OpenStreetMap, it is used as the assumed driving speed. If no speed limit is available, typical speeds are assumed—for example, 120 km/h on motorways and 70 km/h on roads outside of built-up areas.
Finally, we factor in emission factors, which tell us how much CO₂, CO and NOₓ emissions are released by a given amount of consumed fuel. The fuel emission factors are taken from COPERT (EMEP/EEA air pollutant emission inventory guidebook 2023 – Update 2024, Tables 3-6 and 3-12).
From Insight to Action: the Climate Action Navigator
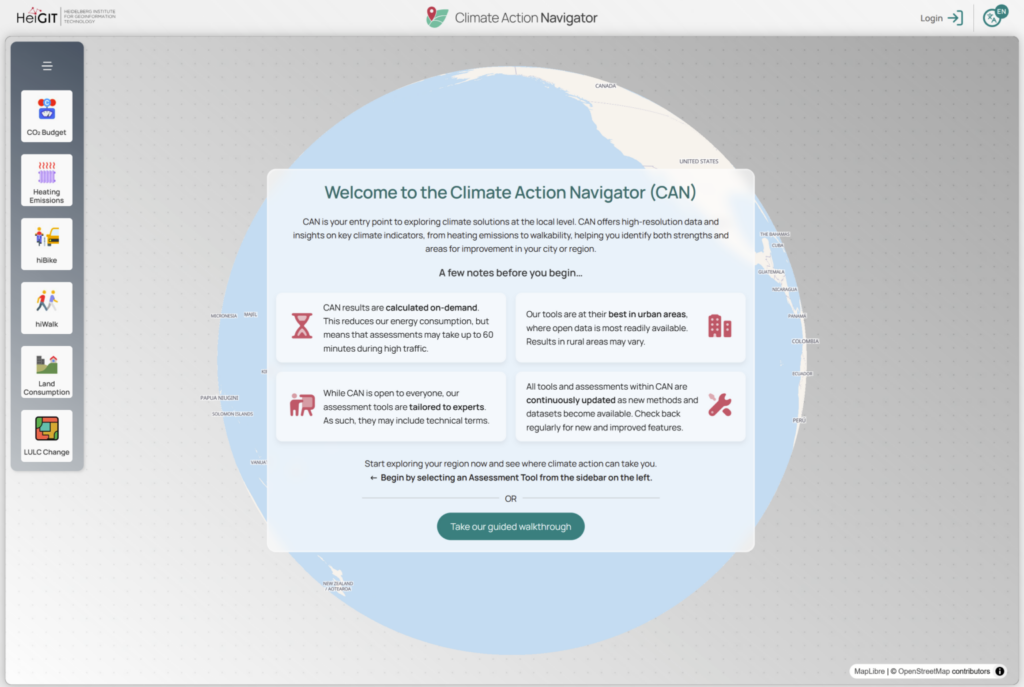
The Climate Action Navigator (CAN) offers several climate action assessment tools on walkability and bikeability, land consumption, land use and land cover (LULC) change, residential heating emissions, and CO₂ budgets. These are designed to help stakeholders such as NGOs, city administrations, citizens’ initiatives to identify strengths as well as gaps of climate mitigation in different areas. As CAN’s assessment tools visualize data at street-level resolution, interventions and improvements can be targeted and consider the specific local context.
Unlike many traditional indices, CAN´s indicators are co-created with urban planners, advocacy groups, and local stakeholders to ensure relevant, practical, and actionable results. Whenever possible, the Climate Action Navigator uses freely accessible data (such as OpenStreetMap and satellite imagery) and open-source software tools, thereby ensuring accessibility, broad applicability, and opportunities for adaptation.
What’s Next?
The Climate Action Navigator is always in progress, as the assessment tools are constantly improved and developed further to meet the needs of our partner organizations. For example, we are planning to release a new transitability tool this summer, which will assess the availability and quality of public transport options.
Get started with the Climate Action Navigator by creating a free user account and exploring your neighborhood with the assessment tools. If you want to contribute to the development of the indicators, we welcome collaboration with NGOs, citizens’ initiatives, or city administrations with specific use cases. We also invite research institutions interested in contributing to the scientific foundation of our tools. Contact us at climate-action-navigator@heigit.org.
More information on the Climate Action Navigator and its assessment tools can also be found on the project webpage, in our blog, and, of course, on the Climate Action Navigator dashboard itself.