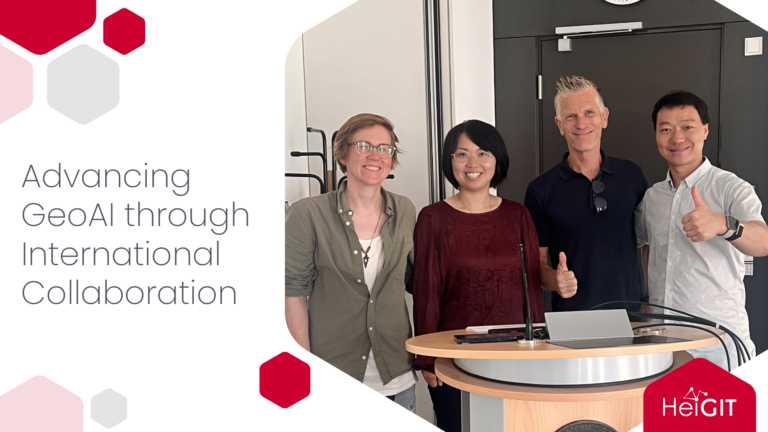
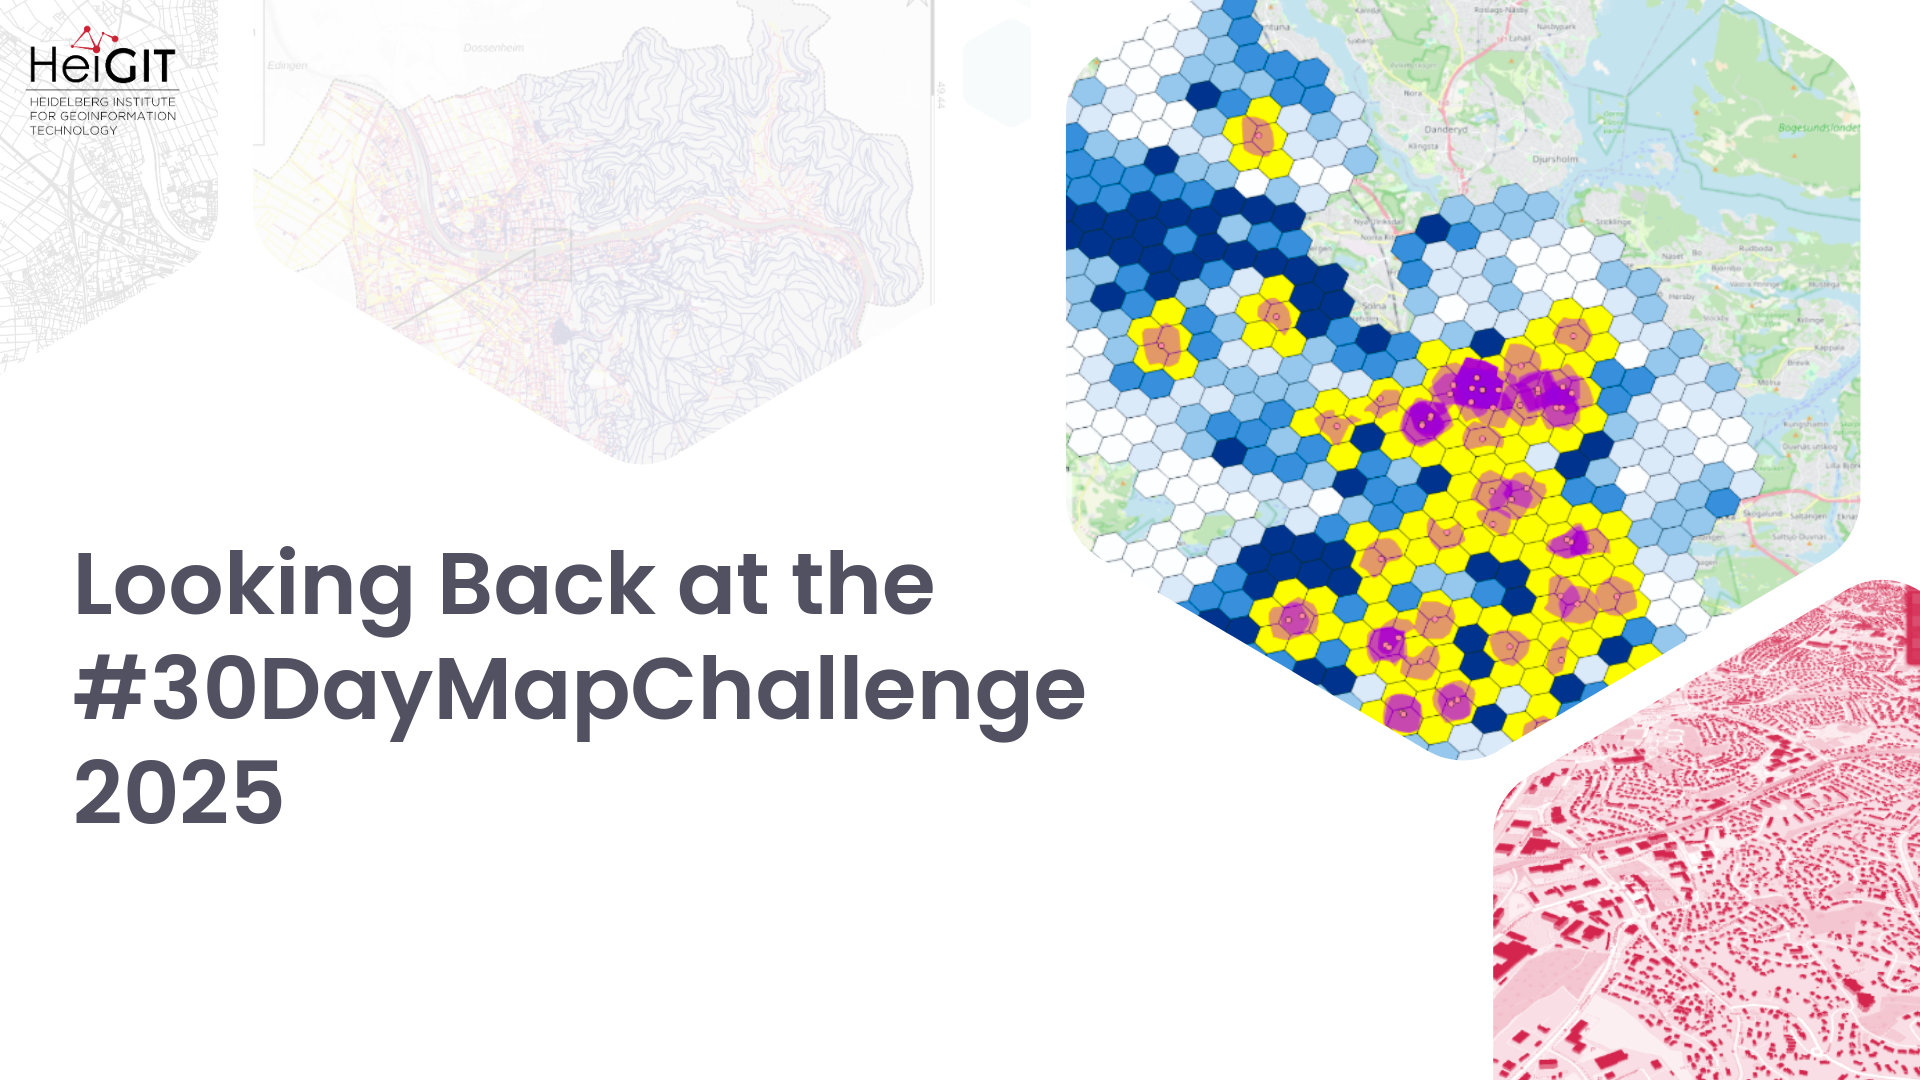
Every November, the #30DayMapChallenge encourages people around the world to make and share maps, with a different theme each day. Cartographer and geographer Topi Tjukanov started the challenge in 2019, and it has since become a global event. You don’t have to sign up or complete all 30 days. Participants can choose the themes they like and use any tools, data, or technology. The challenge is all about creativity, openness, and a shared love of maps and cartography.
During the 2025 #30DayMapChallenge, HeiGIT shared ten maps covering topics such as public transport, urban accessibility, 3D city models, road infrastructure, heat adaptation, OpenStreetMap, and satellite-based land-cover monitoring. These maps also showcased our latest research, datasets, and tools, and demonstrated how geospatial information can help us understand mobility, infrastructure, environmental change, and accessibility.
Let’s take a look back at our contributions.
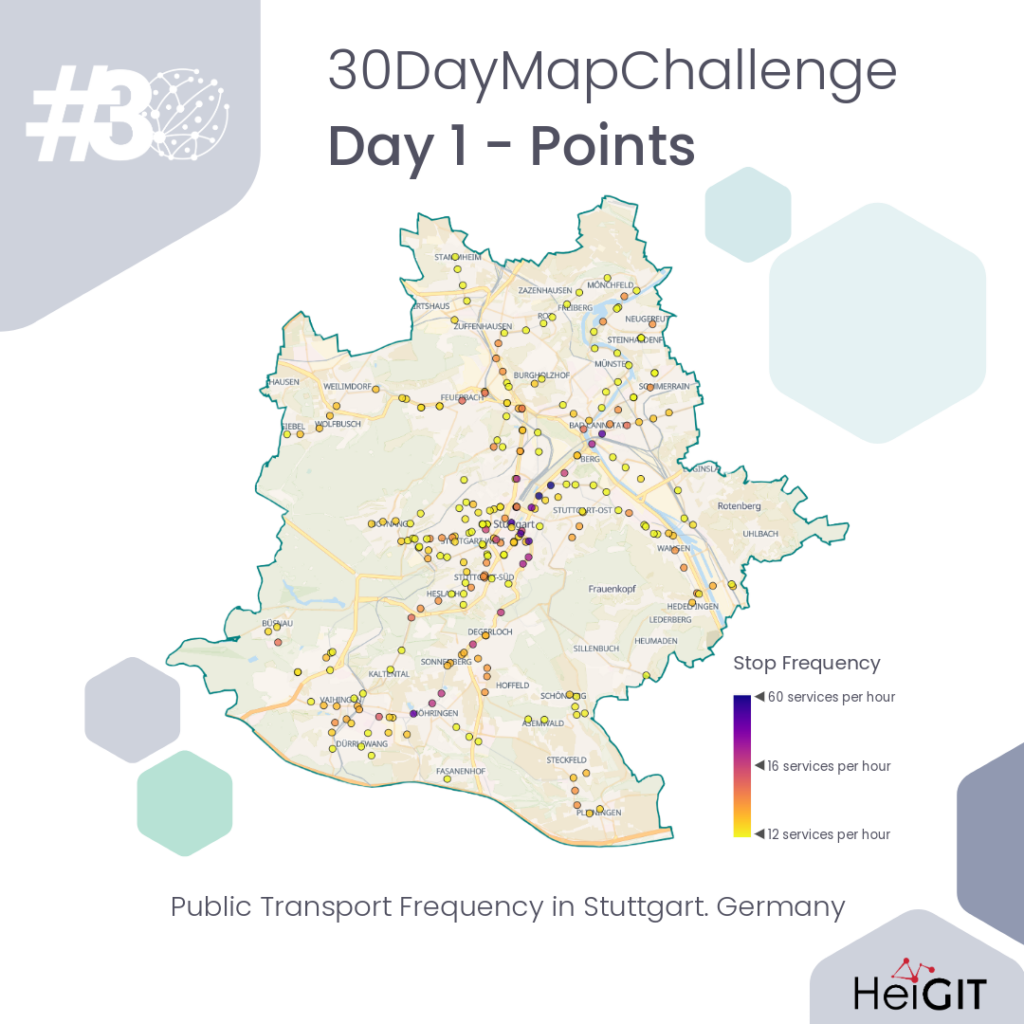
1. 1 November 2025 – Day 1: Points
Public Transport Frequency in Stuttgart, Germany
The first HeiGIT contribution maps public transport stops across Stuttgart and shows how frequently they are served by buses or rail between 7 a.m. and 7 p.m. on weekdays. Frequent service is an important part of a high-quality public transport network, as it provides people with more mobility options. The map offers a preview of HeiGIT’s ongoing work on transitability for the Climate Action Navigator
2. 2 November 2025 – Day 2: Lines
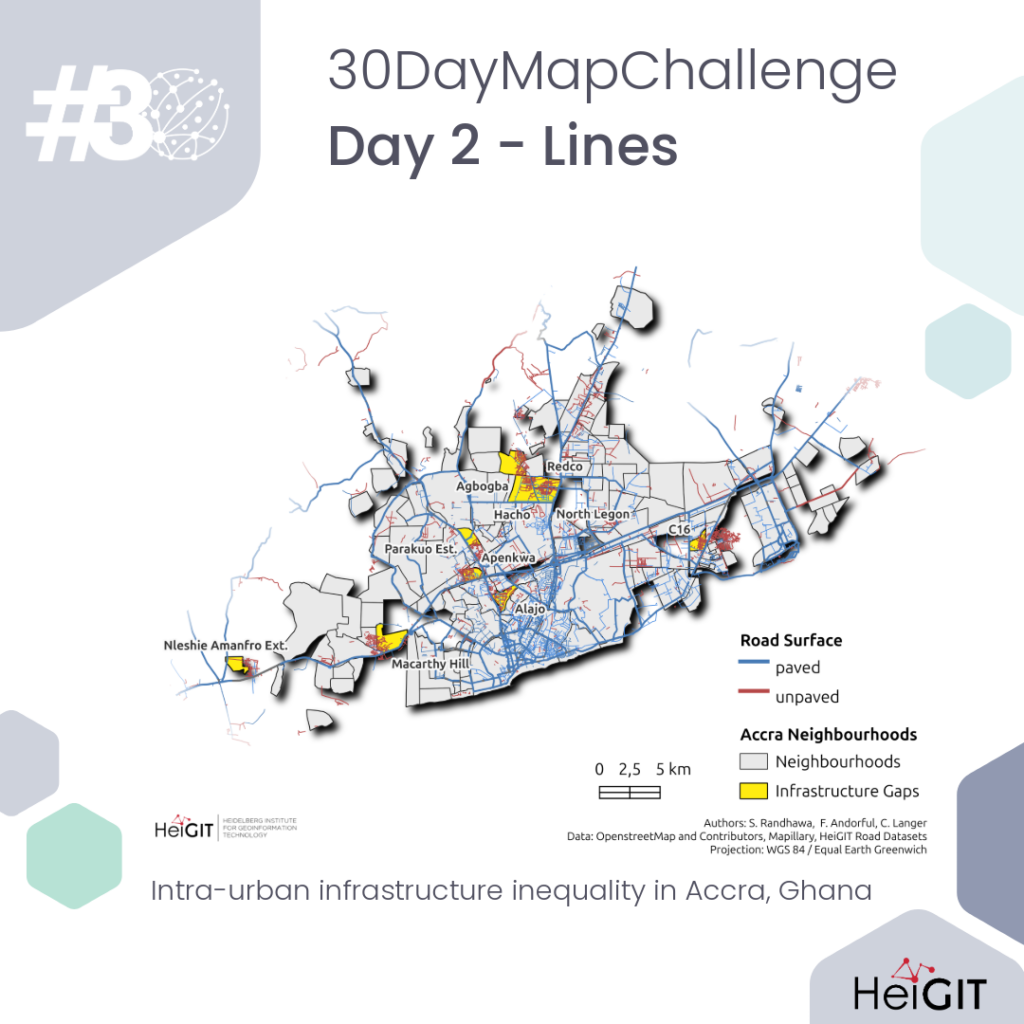
Intra-urban Infrastructure Inequality in Accra, Ghana
This map shows road surface conditions in Accra’s neighborhoods by using Planet data along with earlier Mapillary-based classifications. Neighborhoods with many unpaved roads are marked as “Infrastructure Gaps,” which highlights differences between places like Oblogo and Macarthy Hill and the more central, better-served areas. This closer look can help spot inequalities in road infrastructure and guide fairer urban planning and resource distribution.
3. 6 November 2025 – Day 6: Dimensions
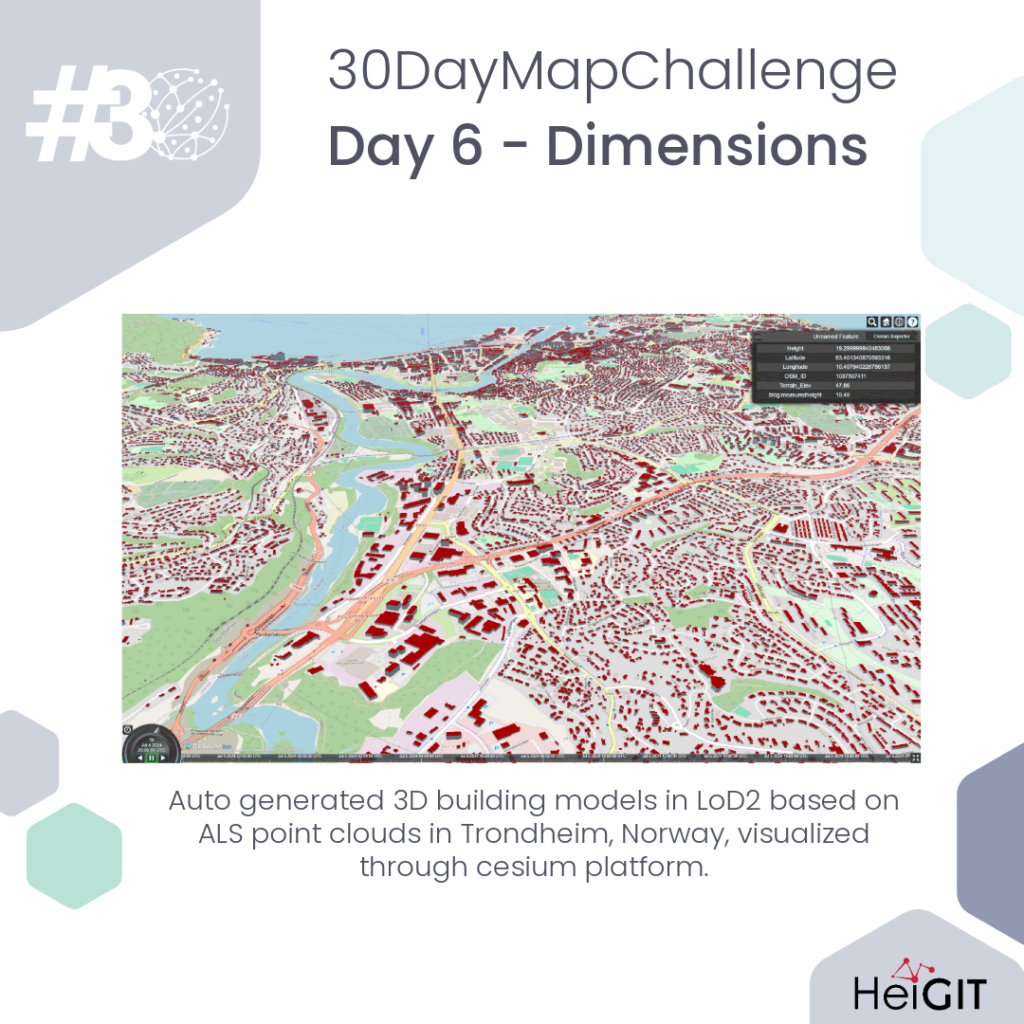
Auto-generated 3D Building Models in Trondheim, Norway
For the Dimensions theme, the map shows Trondheim in 3D by using three-dimensional building models. The LoD2 models were created automatically from ALS point clouds and displayed with the Cesium platform. By combining elevation and geometry, this approach gives a clearer view of the city’s height and structure.
4. 7 November 2025 – Day 7: Accessibility
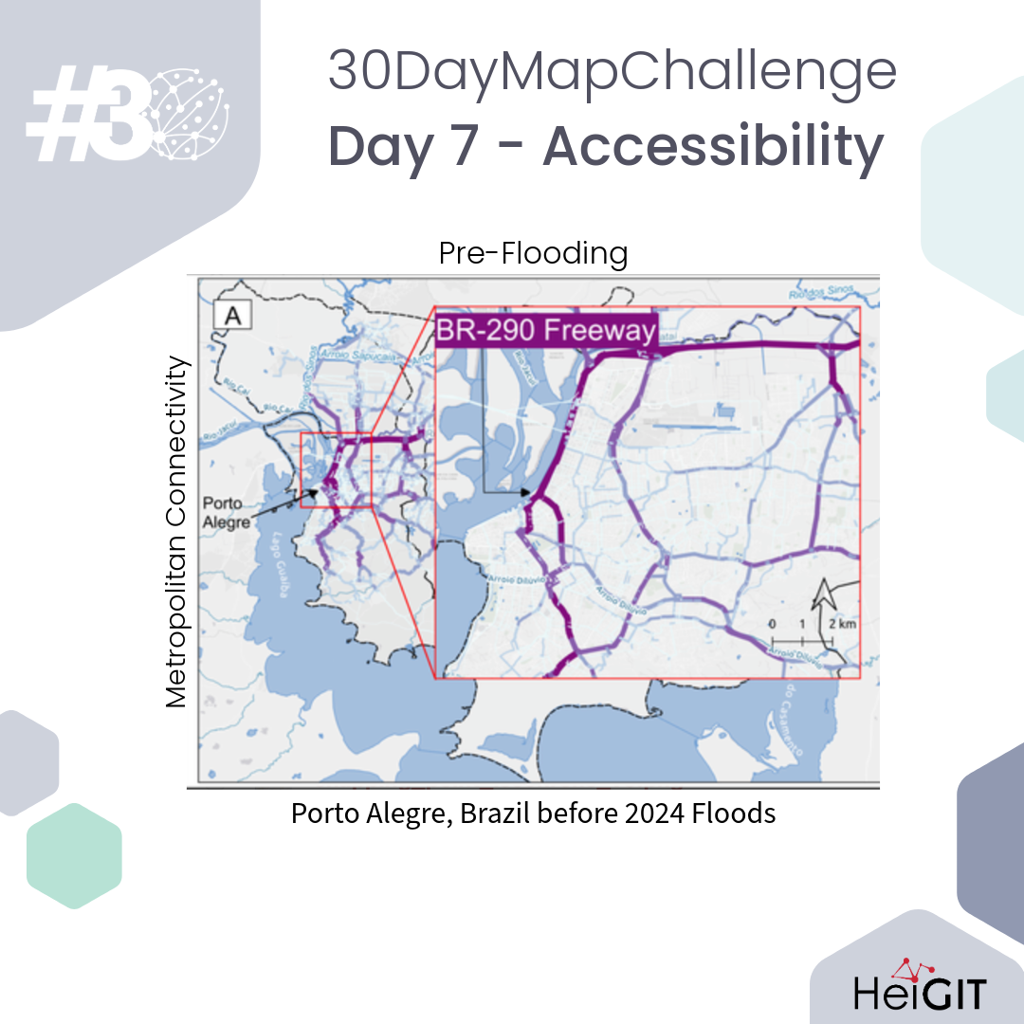
Pre-flooding Accessibility across the Metropolitan Core of Porto Alegre, Brazil
This map shows road accessibility in the metropolitan core of Porto Alegre before the 2024 floods, focusing on the BR-290 Freeway as a key transport route. It is part of HeiGIT’s research on how the floods affected road centrality and hospital access. The findings highlight weak points in the transport network and can support better urban planning.
5. 14 November 2025 – Day 14: OpenStreetMap
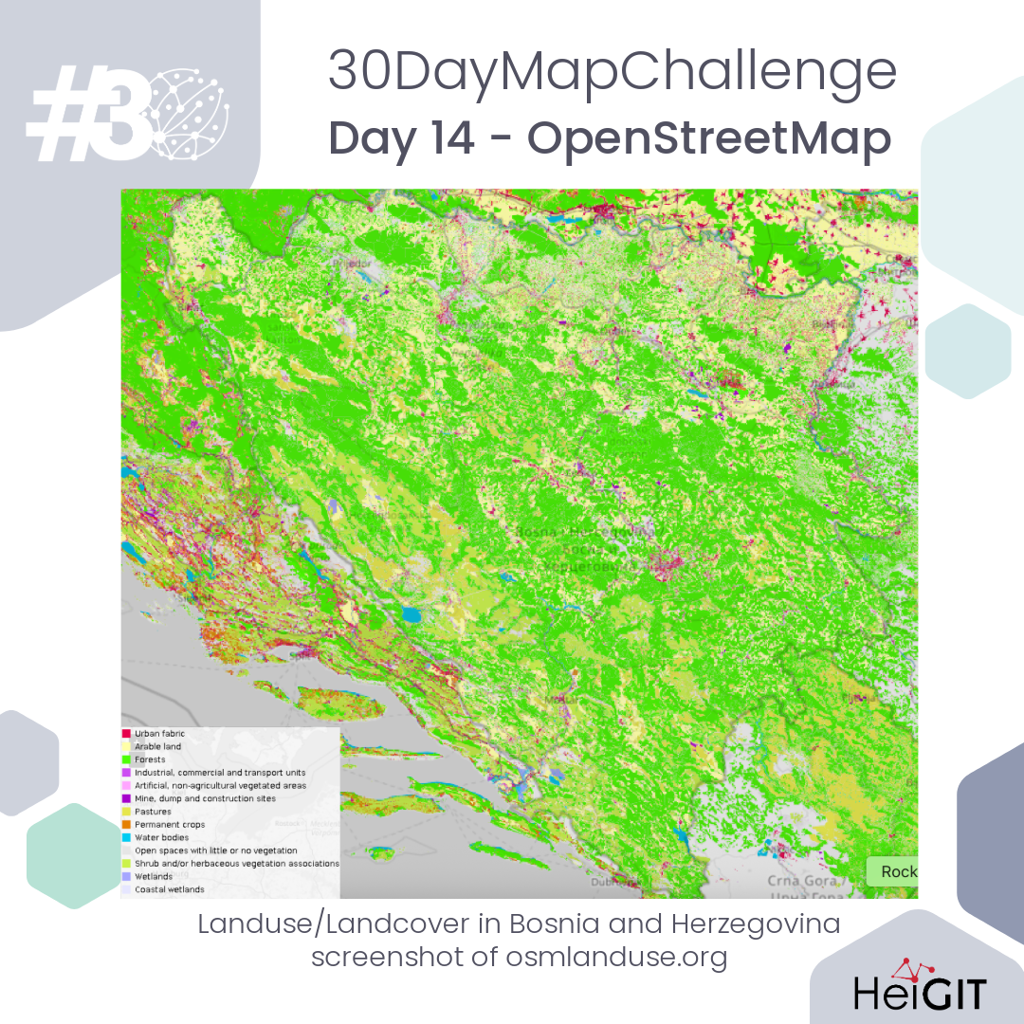
Land Use/Land Cover in Bosnia and Herzegovina
For the OpenStreetMap theme, HeiGIT mapped land use and land cover in Bosnia and Herzegovina using the OSMlanduse dataset, which brings together OpenStreetMap and Copernicus Sentinel-2 satellite data. Most of the country’s land-use information in OSM was added in 2019 and has not been updated since. This shows how hard it can be to keep open geospatial data up to date. The map also brings up questions about how complete and current the data is, and what role imported or AI-generated datasets play in open mapping.
6. 15 November 2025 – Day 15: Fire
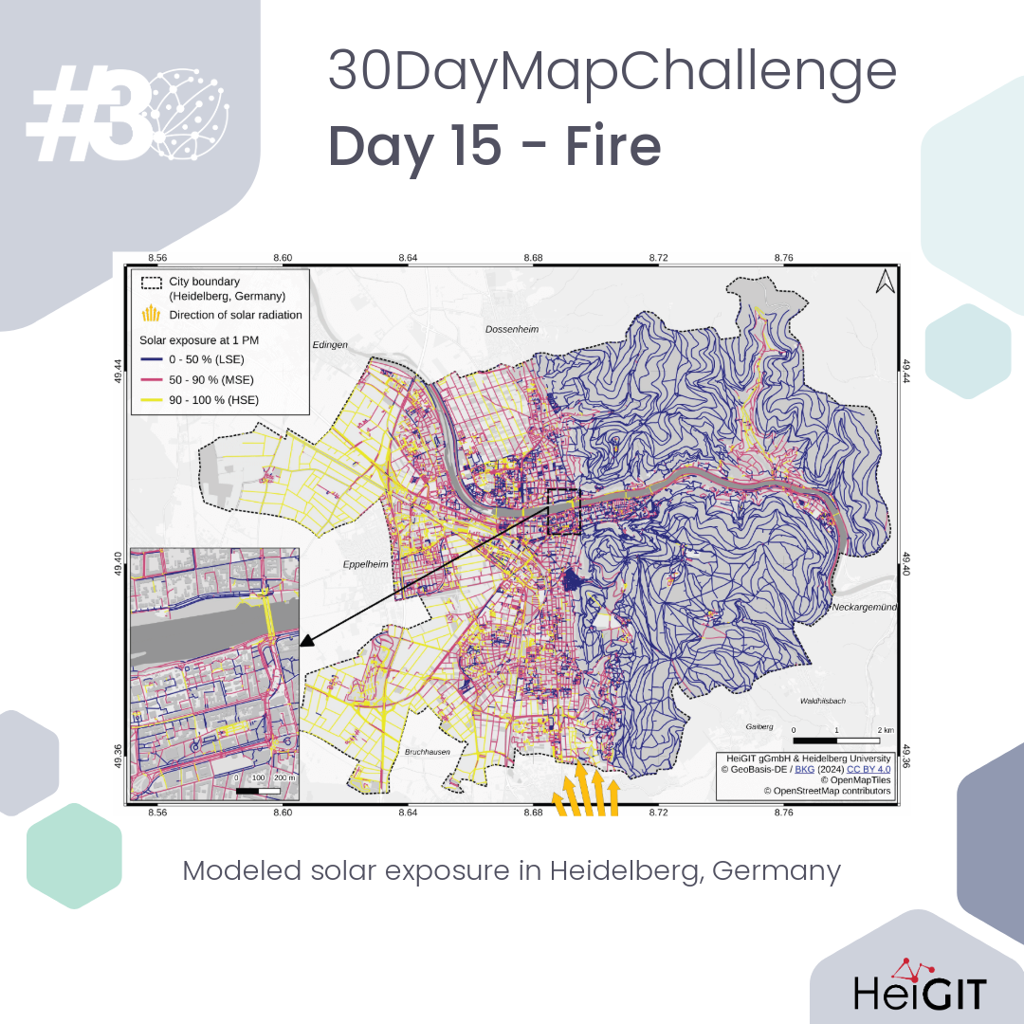
Modeled Solar Exposure in Heidelberg, Germany
For the fire theme, HeiGIT created a visualization of modeled solar exposure across Heidelberg’s pedestrian network on 9 July 2023 at 1 p.m. The analysis used OpenStreetMap data along with detailed building and vegetation models to highlight which areas are highly exposed and which are shaded. The results suggest that choosing routes with more shade can reduce heat exposure with only minor detours and help pinpoint where adding more shade or vegetation would be most effective.
7. 23 November 2025 – Day 23: Process
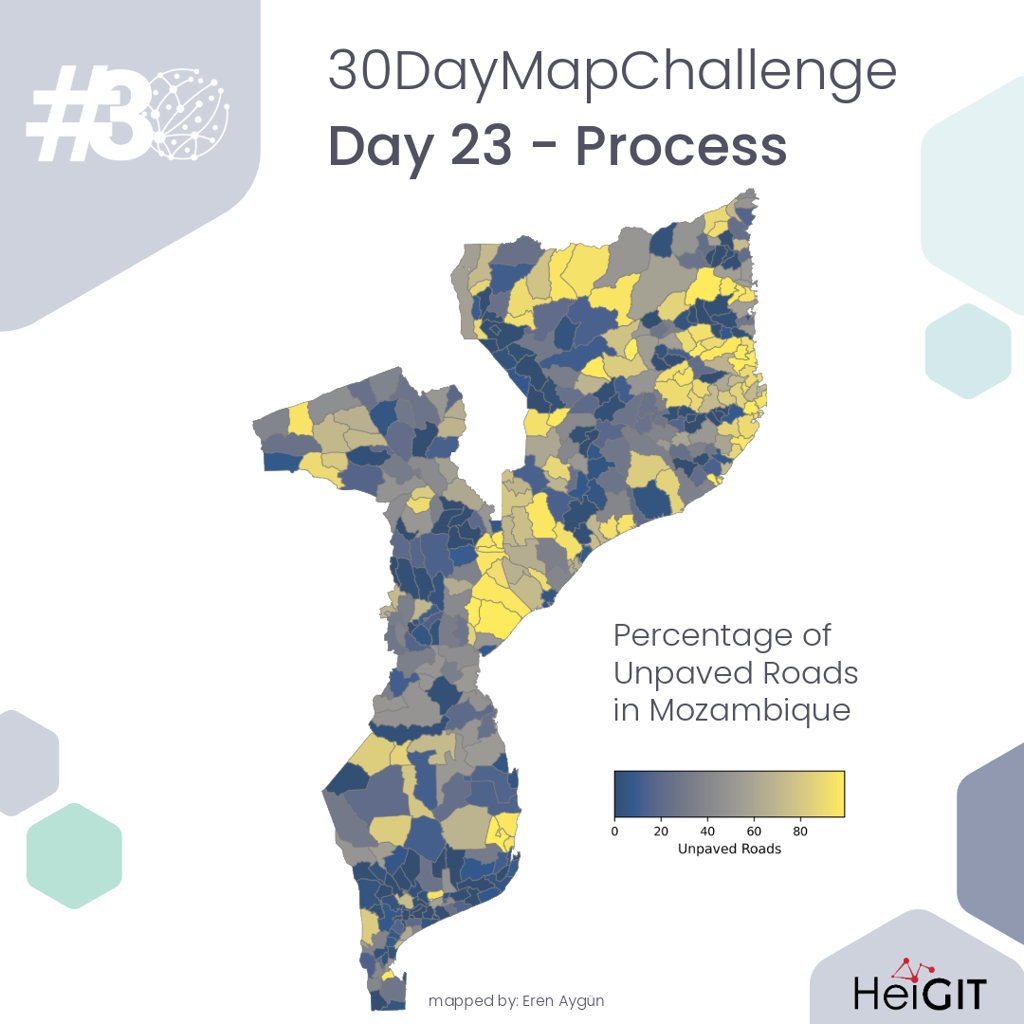
Percentage of Unpaved Roads in Mozambique
This map uses HeiGIT’s Road Surface Dataset to show the share of paved and unpaved roads in Mozambique. Roads are grouped as either paved or unpaved, and their total length is measured for each district. This helps highlight regional differences in the country’s road network. The data can be useful for things like studying accessibility, planning infrastructure, and organizing emergency logistics.
8. 25 November 2025 – Day 25: Hexagons
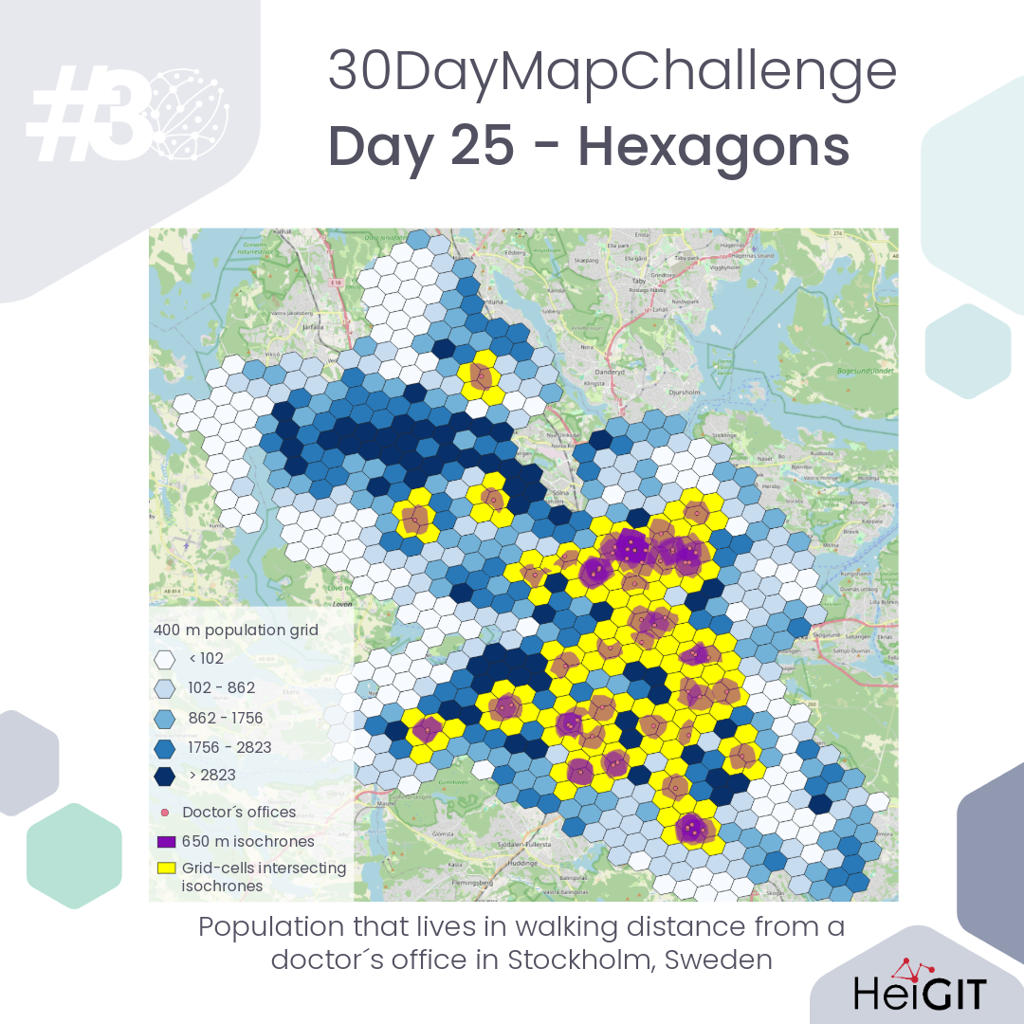
Healthcare Accessibility on Foot in Stockholm, Sweden
This map explores how easily Stockholm residents can reach a doctor’s office on foot. Using QGIS and the ORStools plugin, walking isochrones around doctors’ offices were combined with a hexagonal grid representing the city’s population density. The analysis found that around 50% of Stockholm’s population has easy walking access, roughly within one kilometre, to a doctor.
9. 26 November 2025 – Day 26: Transport
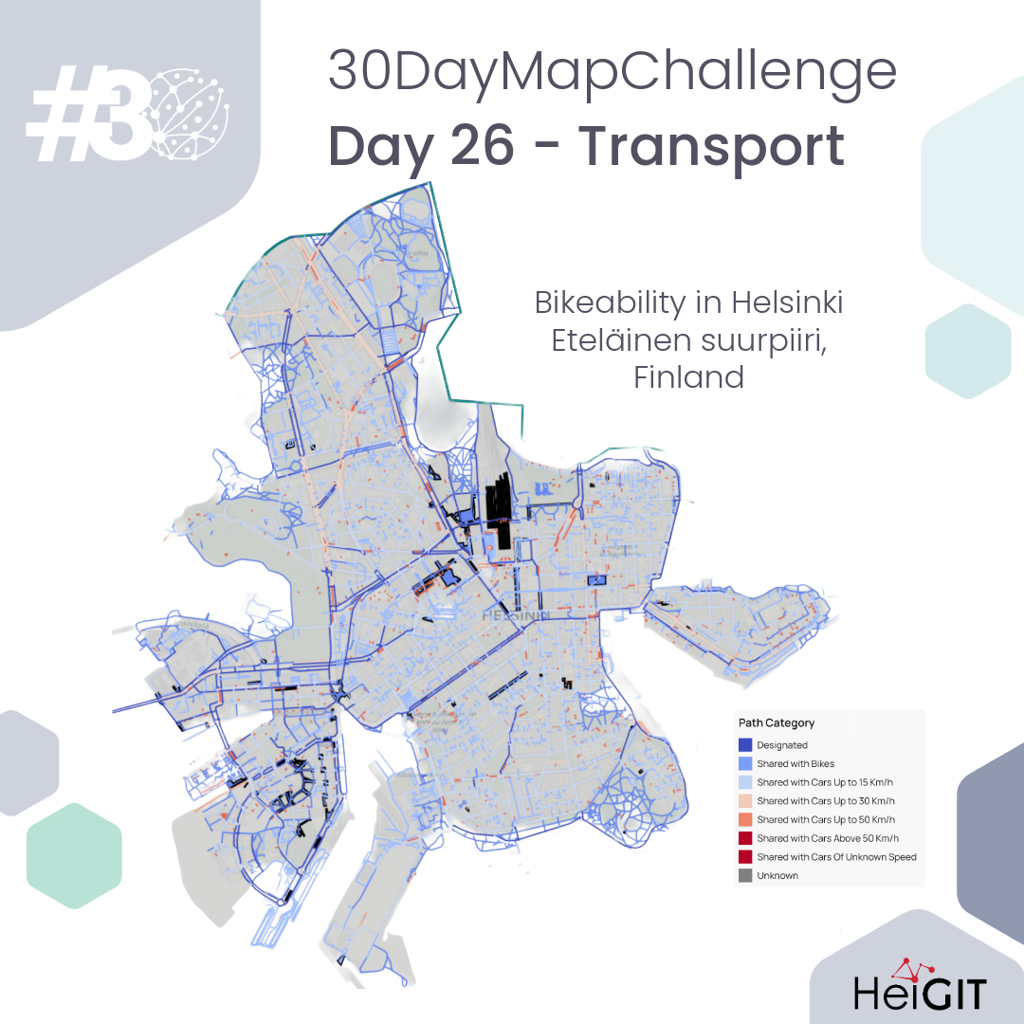
Bikeability in Helsinki, Finland
For the Transport theme, the map uses the hiBIke assessment from HeiGIT’s Climate Action Navigator to look at bikeability in Helsinki. The Path Category indicator sorts bikeable paths based on who cyclists share them with, such as pedestrians or motor vehicles. In the city center, the assessment finds that most streets are either set aside for cyclists or shared only with cars driving at speeds up to 15 km/h.
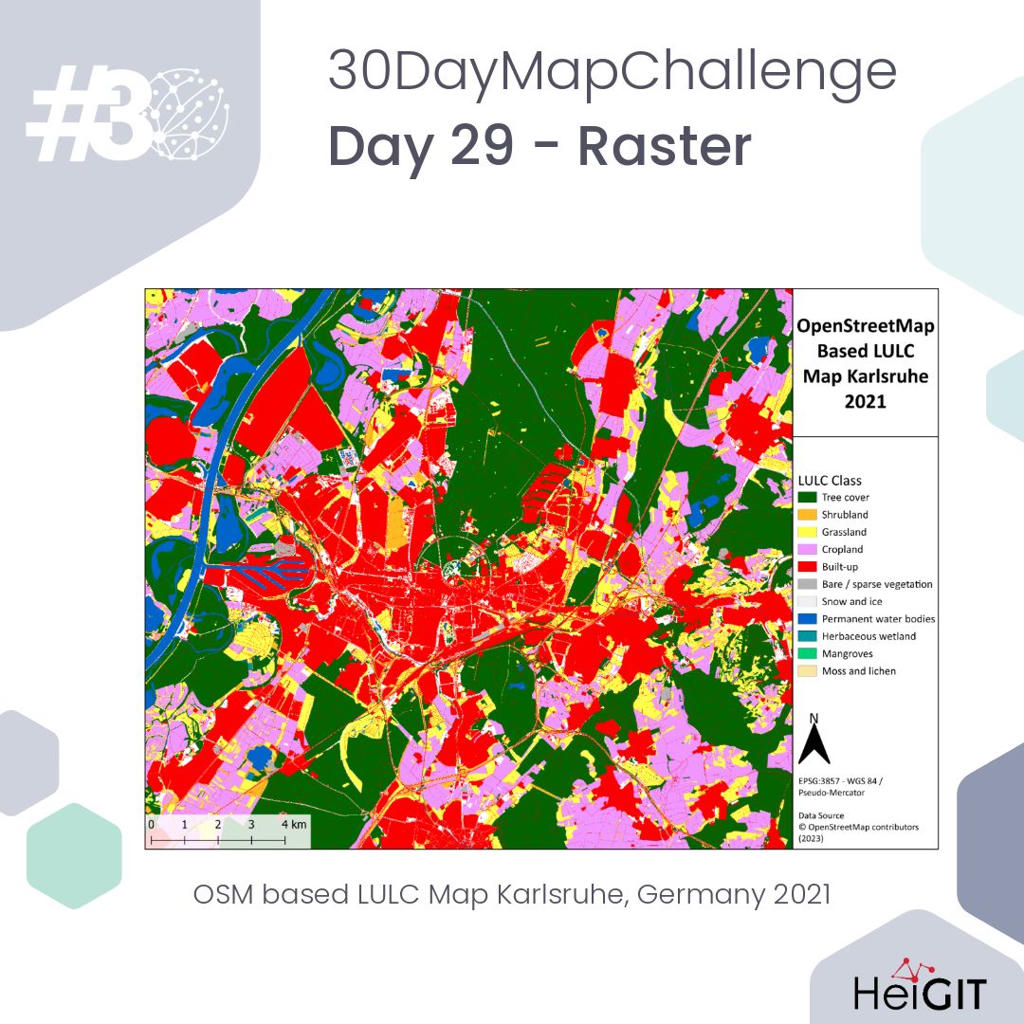
10. 29 November 2025 – Day 29: Raster
OSM-based Land-use/Land-cover Map of Karlsruhe, Germany
HeiGIT’s last contribution presents a land-use and land-cover map of Karlsruhe from 2021, created with OpenStreetMap data as part of the LaVerDi project. LaVerDi brings together OpenStreetMap and satellite raster data from Copernicus Sentinel-2 to make it easier to track changes in land cover. The project also looks at how machine learning can help spot important changes in OSM and support future alert and validation processes.
Looking back at last year’s #30DayMapChallenge, the contributions highlight the variety of ways geospatial data and methods can help us explore topics like mobility, accessibility, infrastructure, climate adaptation, and land-cover change. The maps, whether from research projects, open datasets, or new tools and visualizations, gave a glimpse into the work happening at HeiGIT. We’re excited to see what the next #30DayMapChallenge has in store.