At HeiGIT, we focus on developing useable and useful tools that have real-world impact and that our partners can rely on. Our work is mostly directly driven by our partners´ needs and project requirements. Nonetheless, we want to find the time to also work on the many independent, creative ideas that float among our desks. We do this by regularly implementing flexible, alternative work formats such as Innovation Weeks and Indicatorthons. Thanks to these formats, we have recently made substantial progress on several new indicators for the Climate Action Navigator.
Focus on testing and developing new indicators
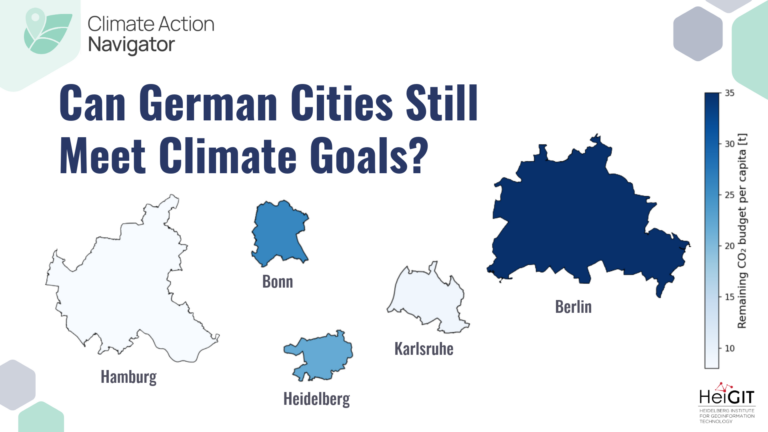
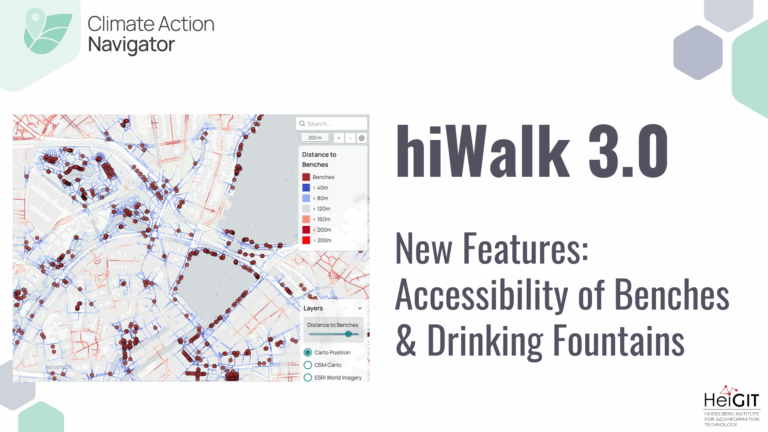
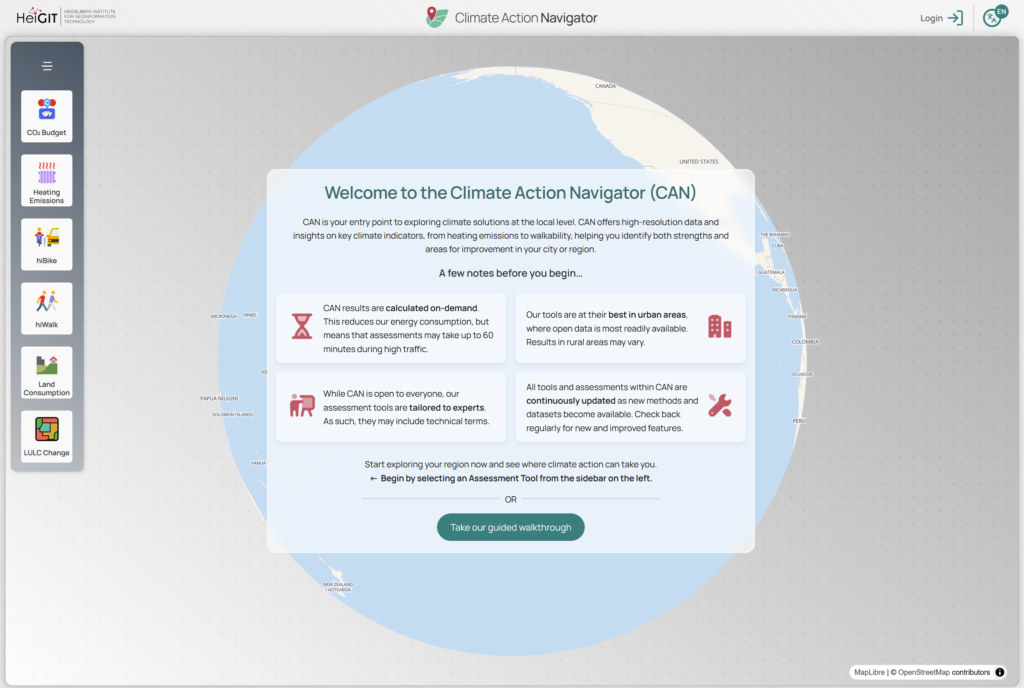
Our Indicatorthons are innovation sprints in the development of the Climate Action Navigator dashboard, which comprises a set of assessment tools related to Climate Action topics, such as active mobility, greenhouse gas emissions, or land consumption. These tools include many different indicators. For example, hiWalk is a collection of indicators for walkability, such as the quality and smoothness of a given path.
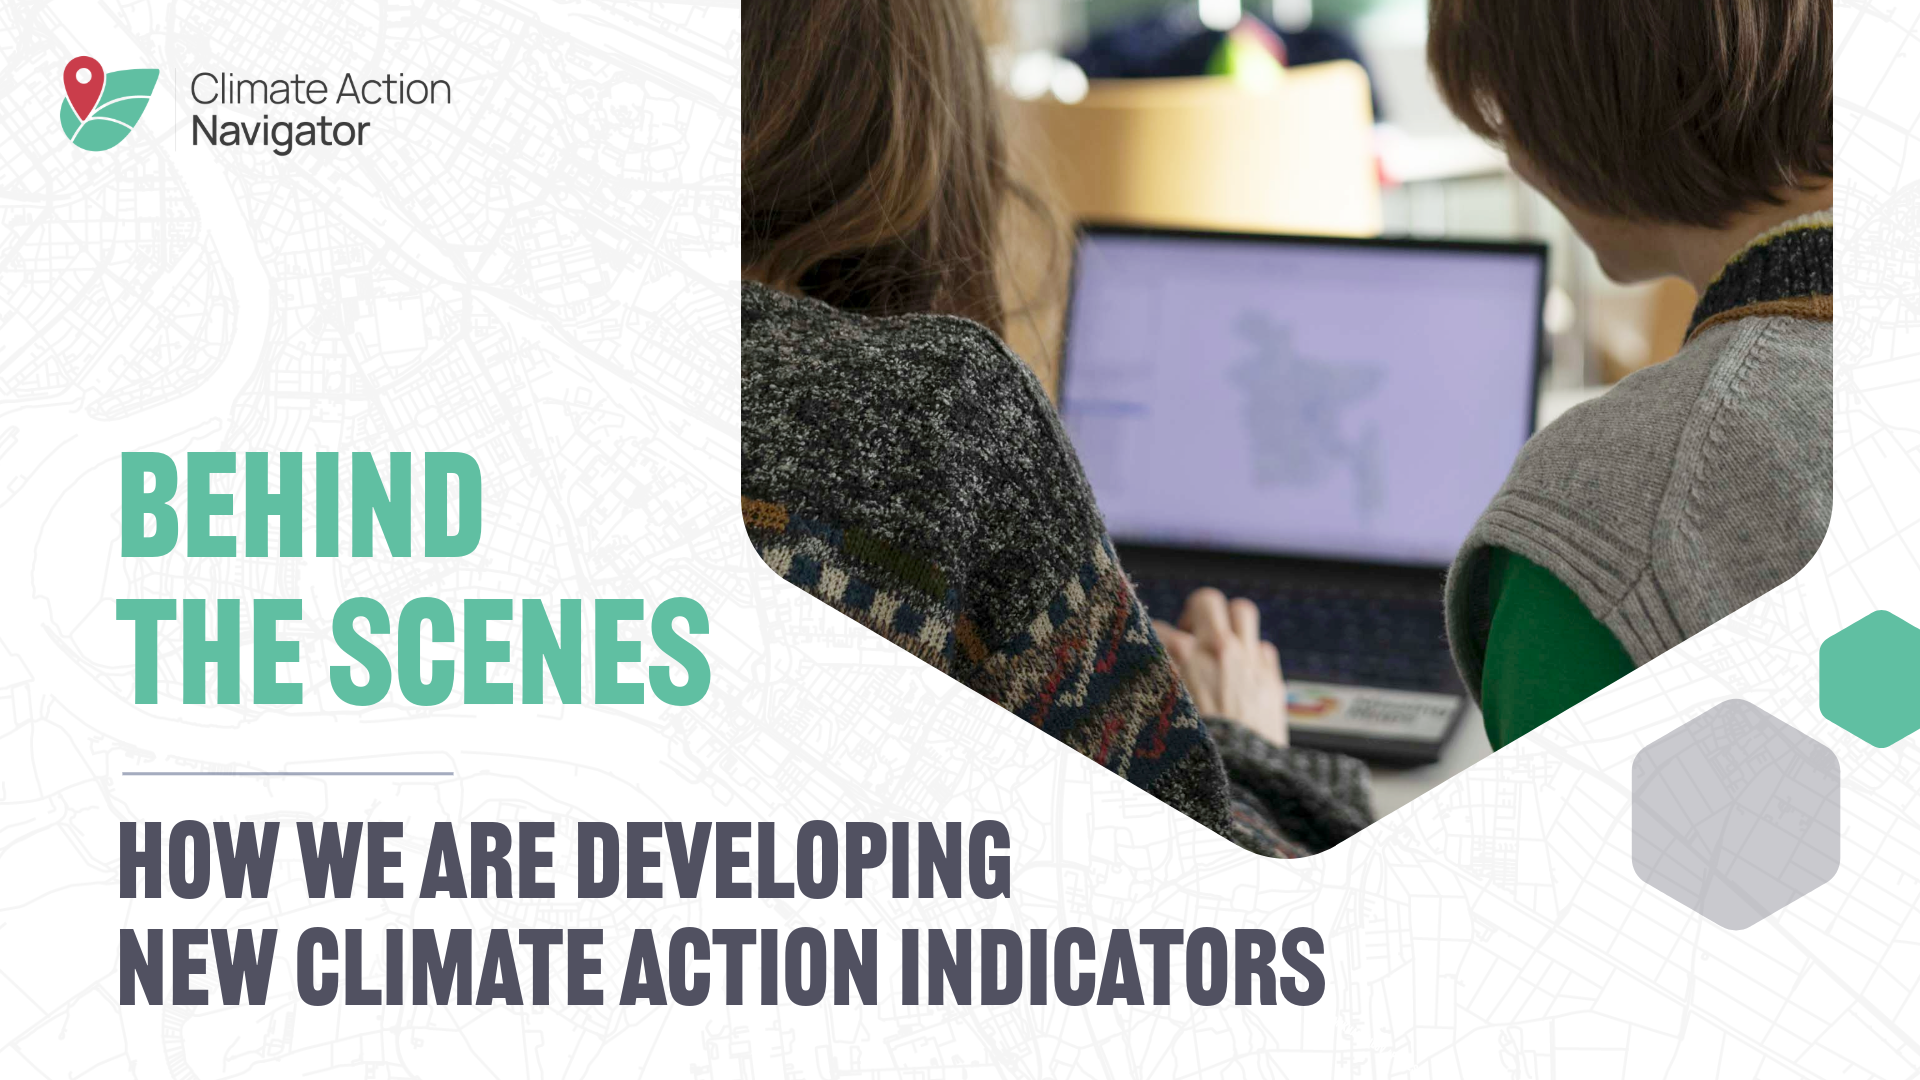
While we always have many ideas for new interesting and relevant indicators, in our day-to-day work, we often only have time to focus on a few of them, depending on the requirements of our project partners. This is why we now and then dedicate some time to take a break from our daily tasks to focus on testing and developing new indicators that are relevant, feasible to implement and relatively straightforward to achieve, but have not been tackled so far. We call this working style “Indicatorthon”. We held our first indicatorthon in December 2024 and January 2025. This successful experiment was repeated in February 2026.
We started by collecting and prioritizing a list of possible topics to work on. These topics were in very different states of development: some were about doing research and assessing general feasibility, some were about developing a proof of concept, and others were about adding a new indicator to an already existing assessment tool. Next, we formed small teams, with each team working on a new indicator idea for a month.
Quick advances in modeling wastewater emissions, road traffic volumes, urban slopes, and more climate-related indicators
During the last Indicatorthon, we were able to quickly advance the development of several climate-related indicators, including a model for daily traffic volume that is scalable to all roads in Germany, a proof of concept for a wastewater treatment emissions indicator, and a prototype for a slope-based mobility assessment indicator.
Daily Road Traffic Volume
We have been developing a machine learning model that estimates the mean daily number of vehicles traveling on a given road, based on OpenStreetMap road attributes such as road type, number of lanes, and speed limit, as well as population data. The model is trained and validated with administrative traffic counts in different regions of Germany. The resulting high-resolution traffic volume estimates will be used to estimate greenhouse gas emissions from road traffic in a new assessment tool that will be added to the Climate Action Navigator dashboard soon. At the same time, traffic volume is also important to assess how pleasant it is to walk or cycle on a given road, which is a relevant indicator for our hiWalk and hiBike tools. Moreover, the high-resolution traffic volume estimates can be used not only to estimate greenhouse gas emissions from road traffic, but also air pollution (e.g. particulate matter, nitric oxide, etc.).
Wastewater Treatment Emissions
We developed a new assessment tool to estimate greenhouse gas emissions from the treatment of domestic wastewater based on data from the Urban Waste Water Treatment Directive (UWWTD) dataset, which contains locations and descriptions of wastewater treatment plants across Europe. We first used the information in the UWWTD dataset to estimate methane and nitrous oxide (two potent greenhouse gases) emitted at each treatment plant and from the ecosystems into which the treated water is discharged. We then linked each treatment plant to the settlements they serve by matching them with OpenStreetMap boundaries based on multiple factors, such as name or distance from the wastewater treatment plant. We plan to add this new assessment tool to the Climate Action Navigator dashboard soon, and use the UWWTD data for other indicators about the quality of wastewater infrastructure in different regions and the degree to which wastewater contributes to environmental pollution.
Slope-Based Mobility Assessment
With respect to walkability and bikeability, slope greatly influences accessibility, especially for vulnerable groups such as young children and elderly citizens. We prototyped approaches to calculate the slope along a given path based on digital elevation model data from Mapterhorn, which has a spatial resolution of about 1 m for many areas in Europe and North America. This very high resolution enables much more precise slope assessments than before. Slope is set to be added as a new indicator to the hiWalk and hiBike tools. This expansion will support the evaluation of path accessibility, further contributing to livable and sustainable urban planning.
Why should we do Indicatorthons regularly
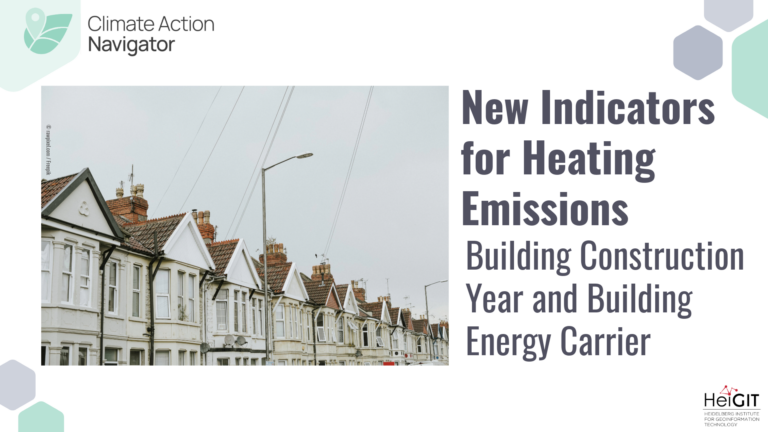
In addition to the projects mentioned above, we have also been working on adding the quality of signposted bicycle routes to the bikeability assessment tool hiBike, as well as on expanding the Heating Emissions assessment tool by estimating also the indirect emissions associated with the heating of residential buildings.
All these short, focused sprints helped us learn quickly, innovate collaboratively, and make rapid progress on draft indicators. If we did not set aside time every now and then to focus on indicator development, we would not be able to develop new and innovative indicators this quickly. The proofs of concept developed in the Indicatorthon form the basis for adding new indicators to the Climate Action Navigator, which will increase the scope of our dashboard and widen the group of potential users. By presenting our ideas to colleagues from other teams before going public, we could gather valuable feedback early, ensuring that user perspectives are considered from the start and increasing the potential for successful integration into the dashboard.
It is natural and expected that not every proof of concept developed in the Indicatorthon will make it to the Climate Action Navigator dashboard. If we find out during an Indicatorthon that an idea is not feasible, that is also a success because then we can take the informed decision not to continue working on that.
The next Indicatorthon is already planned for this summer. We are looking forward to it as a fun working style that helps us to remain innovative and make the Climate Action Navigator grow.