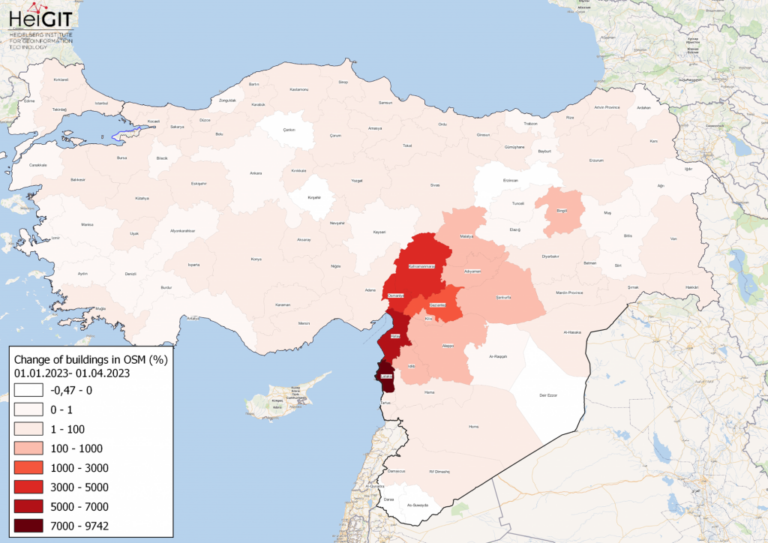
Gezeigte Karte: Prozentuale Veränderung von Gebäuden in jeder Provinz der Türkei und Syriens in OSM. Daten von OpenStreetMap, visualisiert mit QGIS und dem ohsome API Plugin. Willkommen zurück zu unserer…
Hello and welcome back to the How to become ohsome-blog series! We hope the new year started off well for you! If you’re new to the series, you should read…
Welcome back to our blog post series How to become ohsome, where you get short and simple explanations on how you can become ohsome yourself! This time, it’s all about…
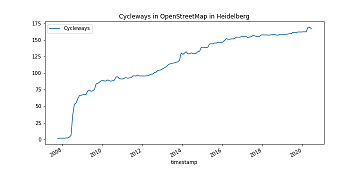
It’s CITY CYCLING time – some of you may even be involved in your municipality – a good opportunity to have a look on the OpenStreetMap (OSM) cycling ways in…
Besides dealing with a snake, making quality assessments, or generating comparable statistics, one needs to know how to handle the whole functionality provided by the ohsome API to really become…
Welcome back to a new episode of how to become ohsome. Yes, you’ve read the heading correctly. We are really talking about a snake in a notebook on another planet….
This is your first blog of the ohsome series? Before you might be confronted with any potential spoilers, you should better check out the first and the second part of…
This blog post is the start of a series of posts, which describe what you are able to do using the ohsome framework developed at the Heidelberg Institute of Geoinformation…