In just 15 days, on May 15th, we will officially launch the Climate Action Navigator (CAN): HeiGIT’s new dashboard offering high-resolution, open data-based insights into key climate action indicators. From assessing CO2 emissions from residential heating to urban active mobility infrastructure, CAN helps identify where targeted action is most urgently needed.
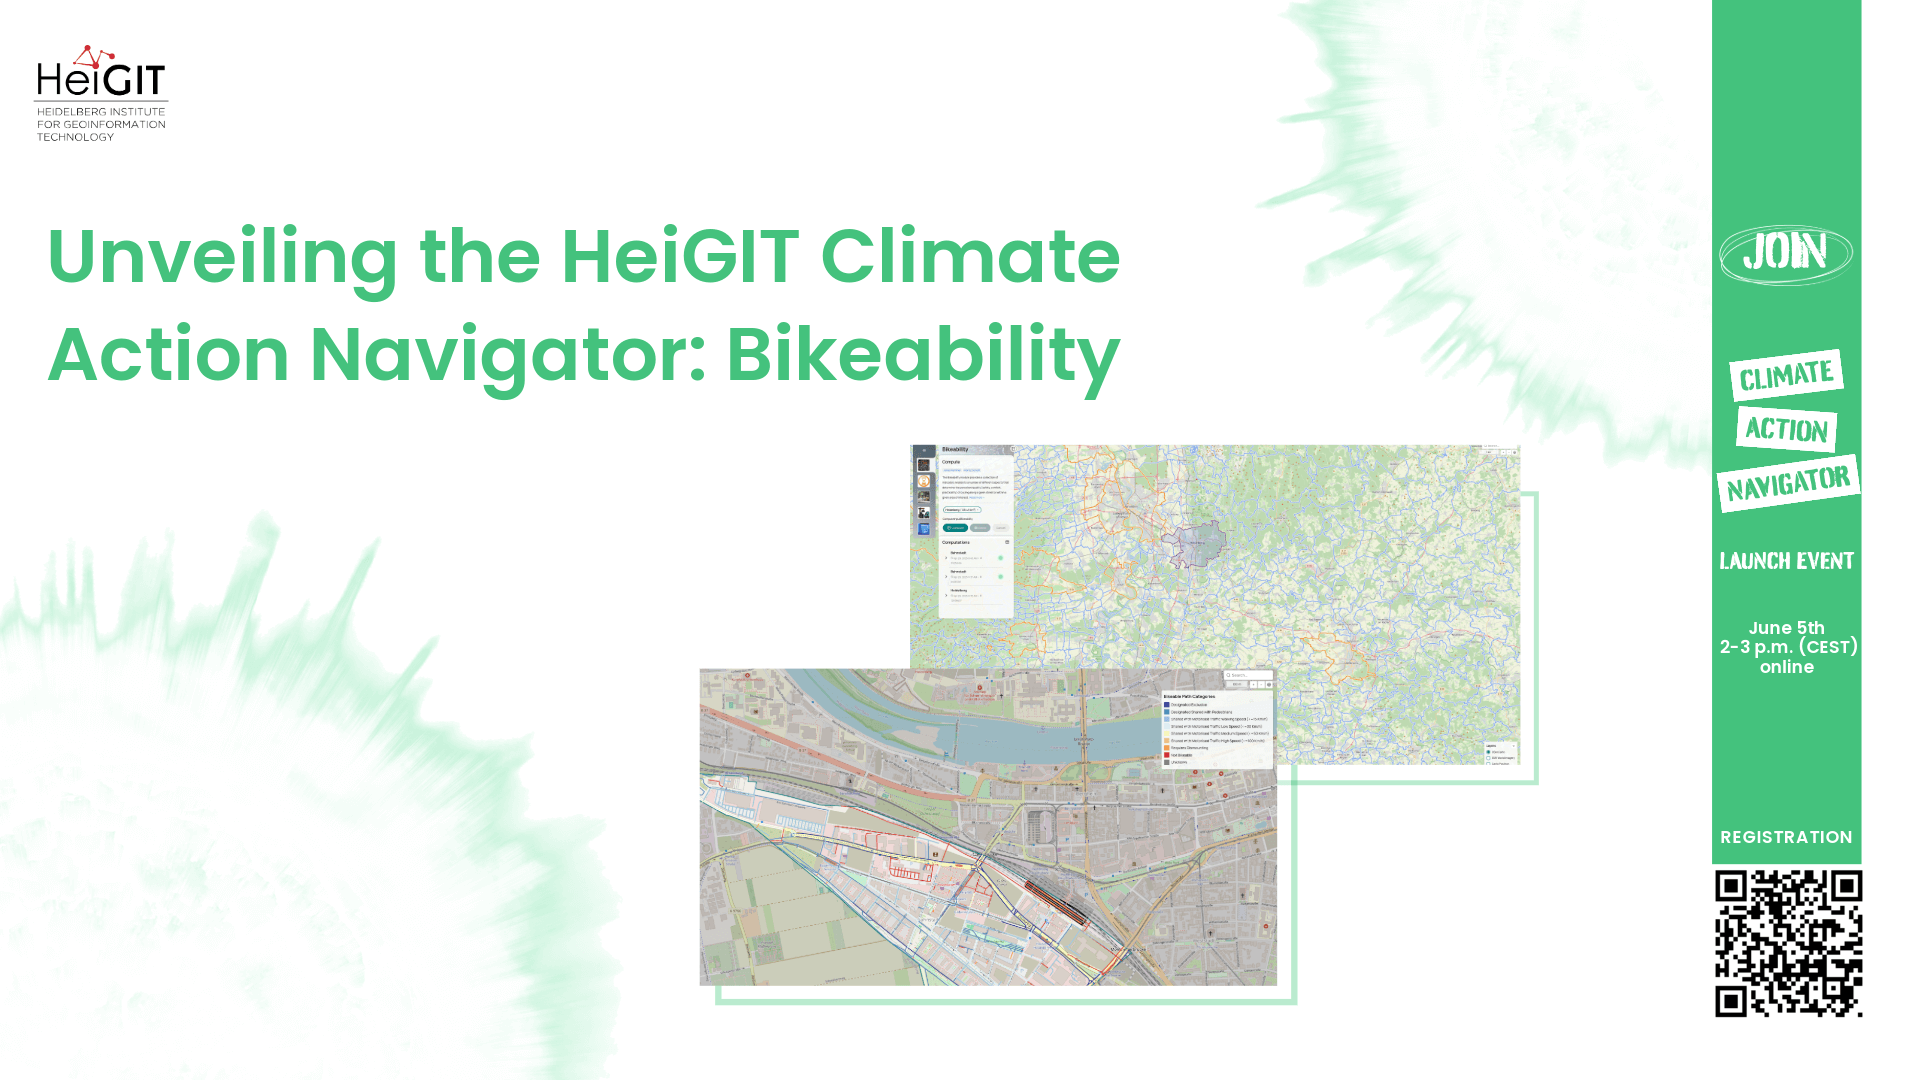
In this second post of our blogpost series, we introduce hiBike, one of CAN’s key assessment tools, which analyzes the bikeability of cities and towns.
Why bikeability matters for climate and quality of life
Cities worldwide strive to reduce carbon emissions, improve public health, and enhance urban livability. As all of these are influenced significantly by the transport sector, the transition to sustainable mobility – especially cycling and walking – is of utter importance for healthier and more accessible towns and cities. Walking and cycling, collectively termed “active mobility,” are key factors of sustainable mobility and are central to the vision of 15-minute cities, where essential services are within walking or cycling distance. However, not all urban environments are equally safe or accessible for cyclists.
To address this, HeiGIT developed hiWalk and hiBike, open-source, street-level assessment tools for walkability and bikeability. These tools were developed in close collaboration with stakeholders such as Radlobby Austria, Lagos Urban Development Initiative (LUDI) and PLANUM Fallast & Partner. Together with our partners we have defined, tested, and refined our assessment tools to obtain practical, usable, and actionable results.
What does hiBike measure?
hiBike assesses bikeability by analysing specific aspects of the urban street infrastructure. Currently, it comprises four indicators, each of which contributes to a more concrete, data-based, and detailed picture of how safe and comfortable it is to cycle in a given area.
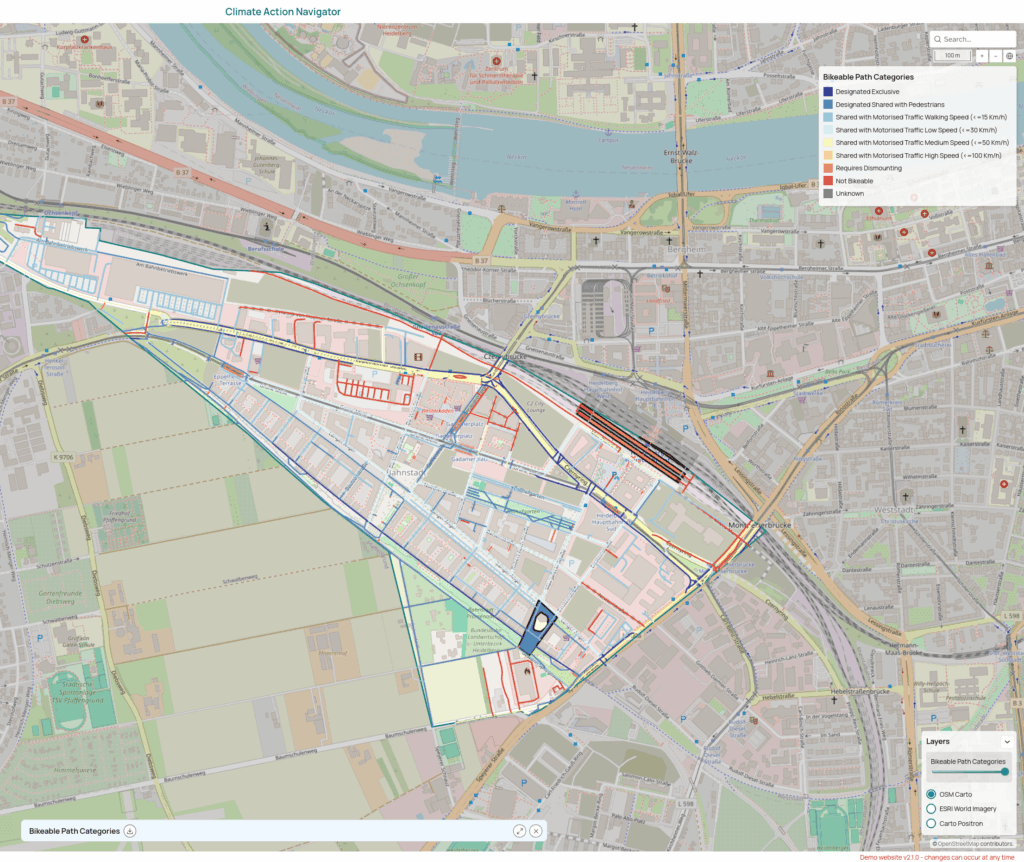
1. Bikeable Path Categories: Who do I share this path with?
This indicator categorises each path based on whether it is exclusively for cyclists, shared with pedestrians or motorized traffic, or unsuitable or inaccessible for cyclists. Paths are classified in nine different categories, ranging from exclusive use to shared with high-speed traffic. Paths designated for exclusive bicycle use are generally safer and more comfortable while cycling. The classification is based on OpenStreetMap (OSM) tags, e. g., whether there are cycle tracks or cyclists must share streets with motorised traffic.
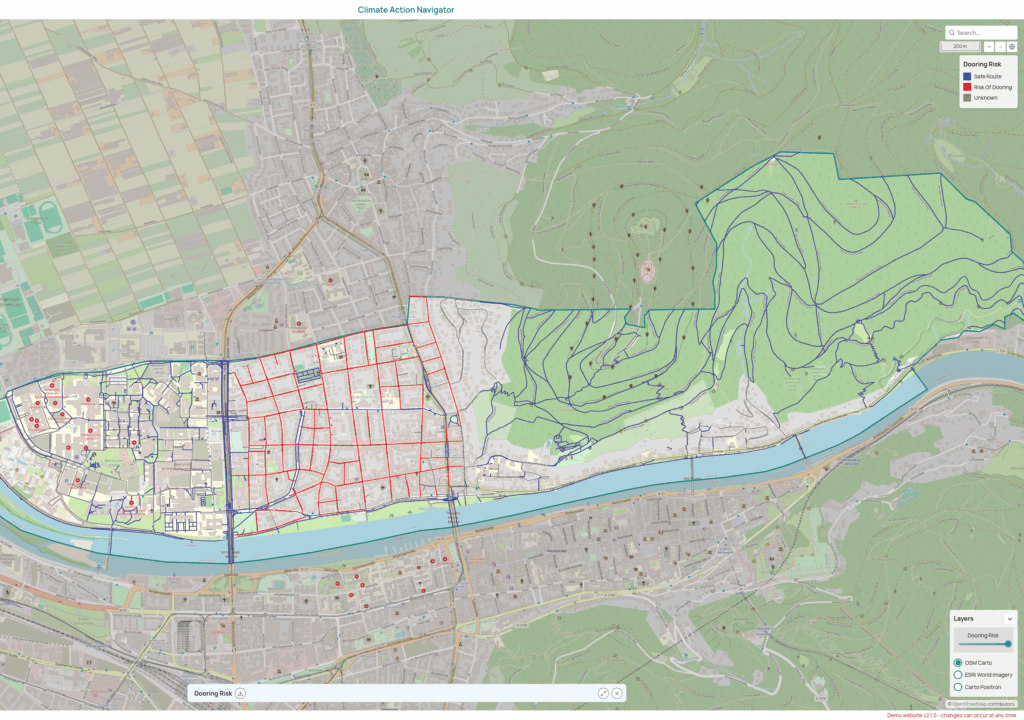
2. Dooring Risk: How likely is it that I get doored by a parked car?
Dooring, i. e. when a cyclist is being hit by an opening door of a parking car, is a frequent and serious safety problem. This indicator assigns streets with parallel on-street parking to pose a Dooring Risk. The computation is based on the OSM Tags parking, amenity=parking und parking=streetside. The identification of dooring risk can help traffic planners to prioritise protective infrastructure (like buffer zones or protected bicycle lanes).
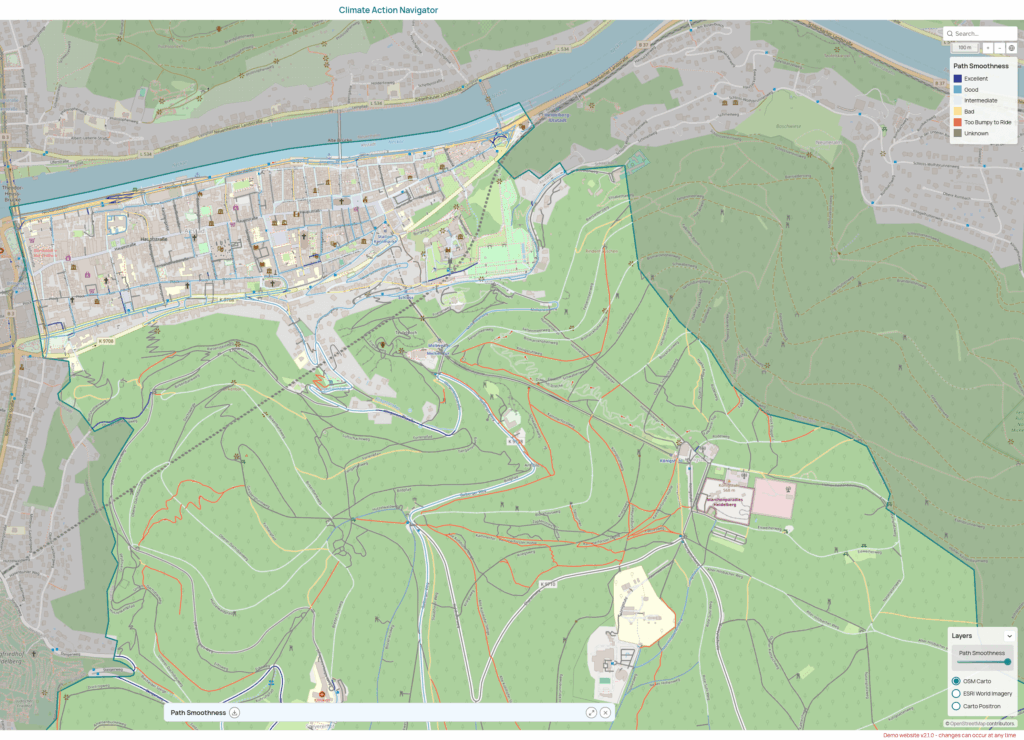
3. Path Smoothness: Is this surface safe and comfortable to ride on?
Cycling is much safer and comfortable on smooth and well-maintained paths than on poorly maintained and bumpy, muddy, or slippery surfaces. This indicator uses OSM smoothness tags to rank surface conditions from excellent (e. g., freshly paved asphalt) to too bumpy to ride. Path smoothness is crucial for many people, e. g. for those with road or racing bikes, or families with children. At the same time, smooth surface result in more joyful cycling for all.
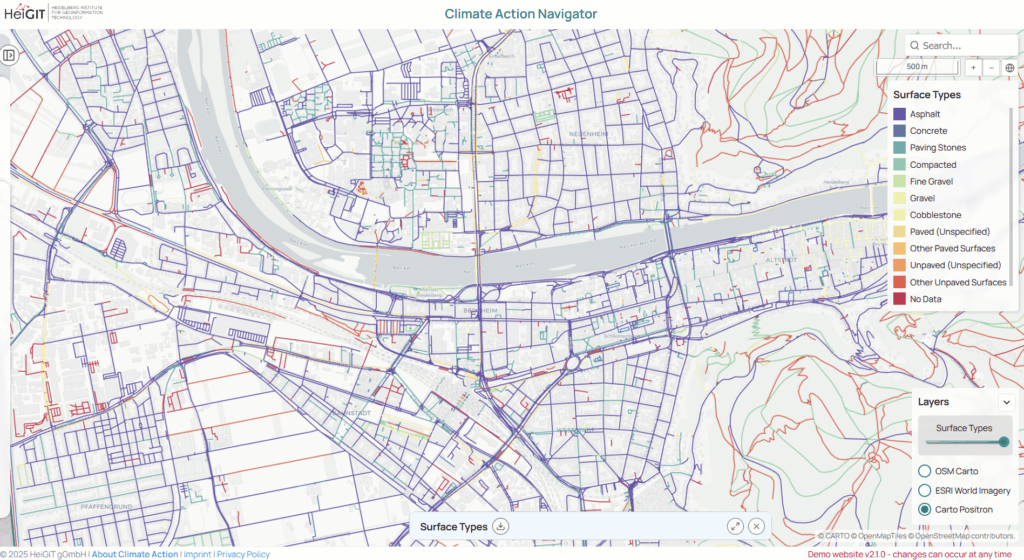
4. Surface Types: What material is the path made of – and is it good for cycling?
Though related to smoothness, this indicator categorises the type of surface material, such as asphalt, gravel, cobblestones, or paving stones. Certain materials (e. g., asphalt) are generally good for cycling, while others (e. g., cobblestones) are rather uncomfortable or even unsafe. hiBike uses OSM surface tags to map and categorise surface types across cities. The map in the CAN differentiates between various surface types, and thus identifies cycling infrastructure that needs to be improved.
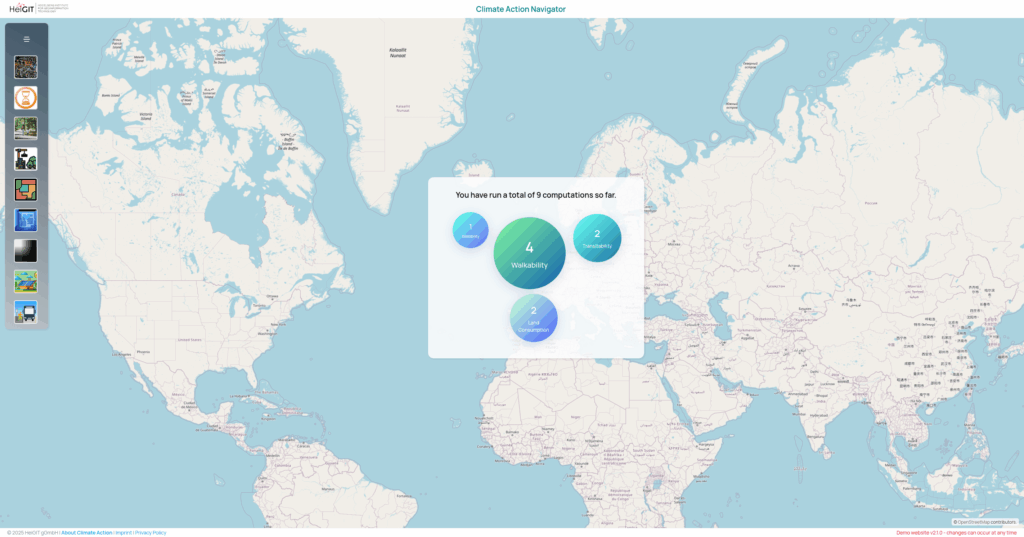
From insight to action: The Climate Action Navigator
The Climate Action Navigator offers several climate action tools such as hiBike, hiWalk, Heating Emissions, and more to come soon. These are designed to help stakeholders such as NGOs, city administrations, citizens’ initiatives to identify strengths as well as gaps of climate mitigation in different areas. As CAN’s assessment tools visualize data at street-level resolution, interventions and improvements can be targeted and consider the specific local context. Unlike many traditional indices, hiBike’s indicators are co-created with urban planners, advocacy groups, and local stakeholders to ensure relevant, practical, and actionable results. Whenever possible, CAN’s assessment tools use freely accessible data (like OpenStreetMap and satellite imagery) and open software tools, thereby ensuring accessibility, broad applicability, and adaption opportunities.
What’s next?
hiBike and CAN in general are work in progress. The assessment tools will be constantly improved and developed further to meet the needs of our partner organizations. On May 15, the CAN dashboard will go live, allowing users to explore hiBike and other tools like hiWalk and heating emissions. We warmly invite you to our online launch event on June 5. We will present the asssesment tools, share insights, and discuss how CAN can support your work.
Stay tuned for next blogpost of this series – and in case you missed it, read our post on hiWalk. You can find the blogposts about the previous indicators here.
Do you have questions or feedback? Reach out to kirsten.vonelverfeldt@heigit.org.