This project explores how OpenStreetMap data can complement satellite imagery for tracking land cover changes in Germany. Using a small test area, we compare datasets over time to better understand how real-world changes are reflected in OSM—and how this knowledge can support automated monitoring.
The Federal Agency for Cartography and Geodesy (BKG) has partnered with HeiGIT to improve the detection of landscape changes in Germany. The research, conducted by Mohammed Rizwan Khan, explores the integration of freely available satellite data with crowdsourced OpenStreetMap (OSM) data to support continuous, large-scale land cover monitoring.
This collaboration centers on LaVerDi (Landschaftveränderungsdienst), an operational service hosted by BKG since 2020. LaVerDi provides annual updates on land cover changes based on Copernicus Sentinel-2 imagery. The service is publicly available and designed to support both institutional and general users interested in long-term landscape dynamics.
In this first phase of the project, our focus is on evaluating the added value of OSM as a supplementary data source. Specifically, the phase addresses two main questions:
- Can OSM-based crowdsourcing improve the accuracy and relevance of landscape change detection in LaVerDi?
- Is it feasible to generate a nationwide, crowdsourcing-supported, quality-assured land cover dataset that is more temporally up-to-date than current satellite-only products?
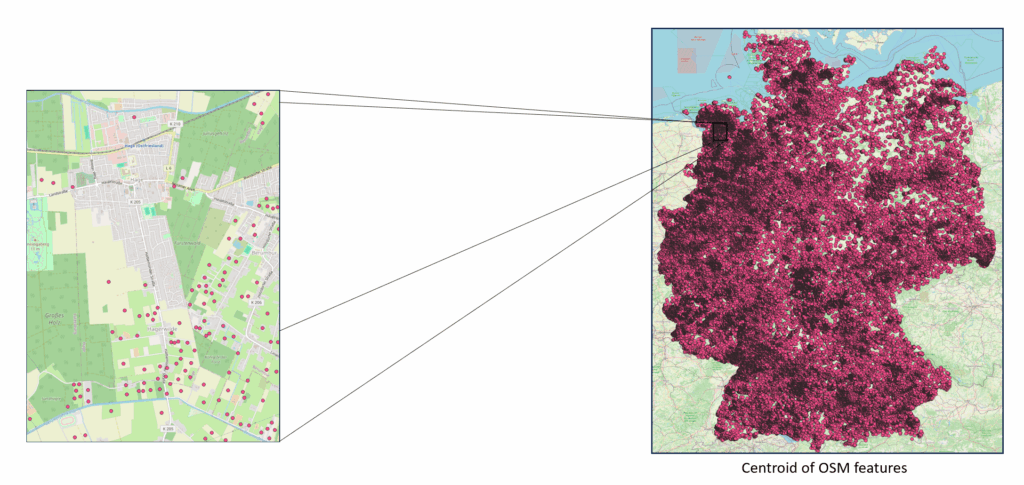
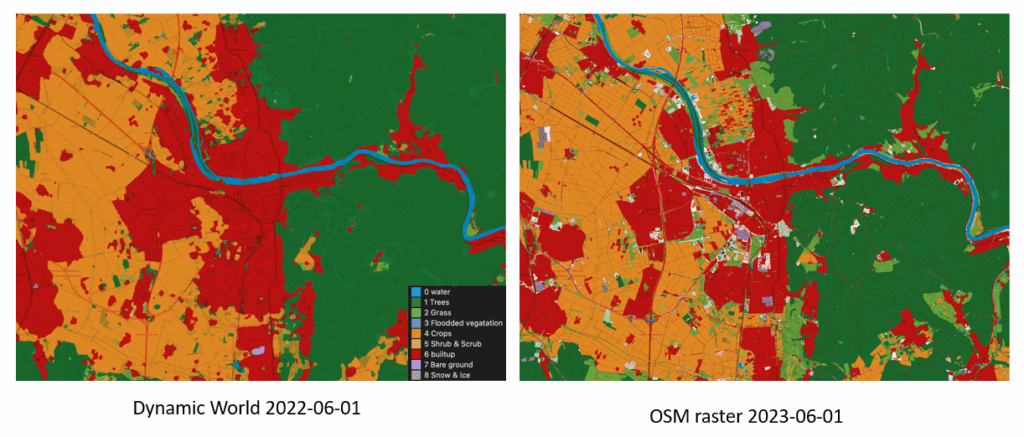
To explore these questions, we identified a test site near Norden, Germany. This area, approximately 5 km × 5 km, showed a high number of recently added or modified OSM features between June 2022 and June 2024. However, as we moved forward with the analysis, we shifted our focus area to the city of Heidelberg. When comparing the OSM changes to the ground reality using satellite imagery, we noticed that many farmland areas had only recently been added to OSM, even though they had existed on the ground for some time.
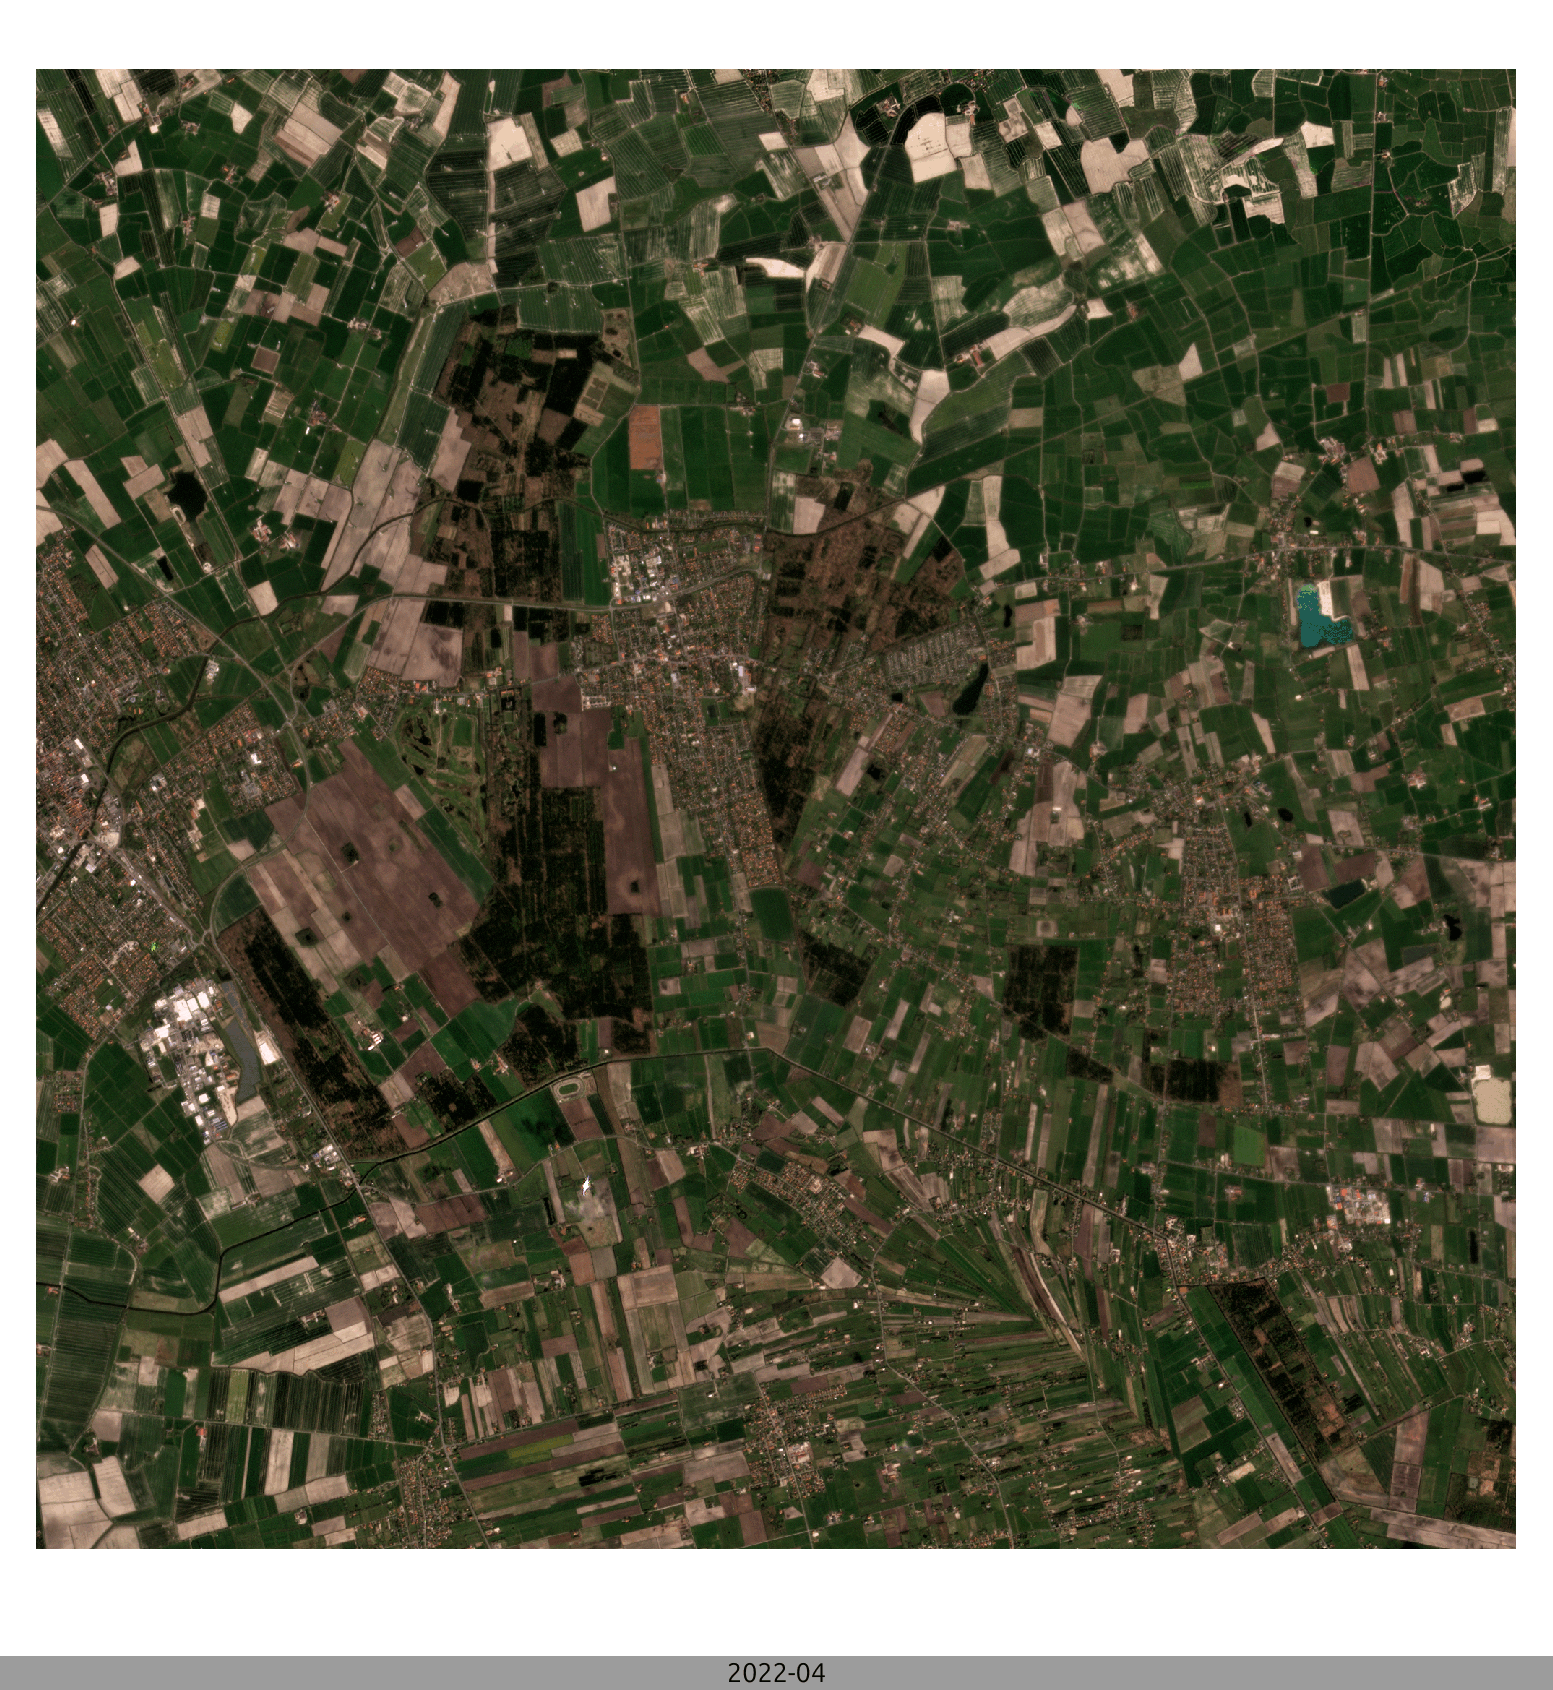
Our initial assumption was that land use changes would largely involve transitions such as forest to built-up or cropland to built-up areas. Based on this, we began by retrieving multi-band satellite imagery and calculating NDVI (Normalized Difference Vegetation Index) and NDBI (Normalized Difference Built-up Index) values.
Using Google Earth Engine, we generated NDVI and NDBI time series for the study area over the past 20 years. Focusing on the last 5–6 years, the indices indicated an increase in vegetation and a decline in built-up areas—results that seemed counterintuitive. But since we’re working with a small and localized study area, we didn’t want to jump to conclusions too quickly.
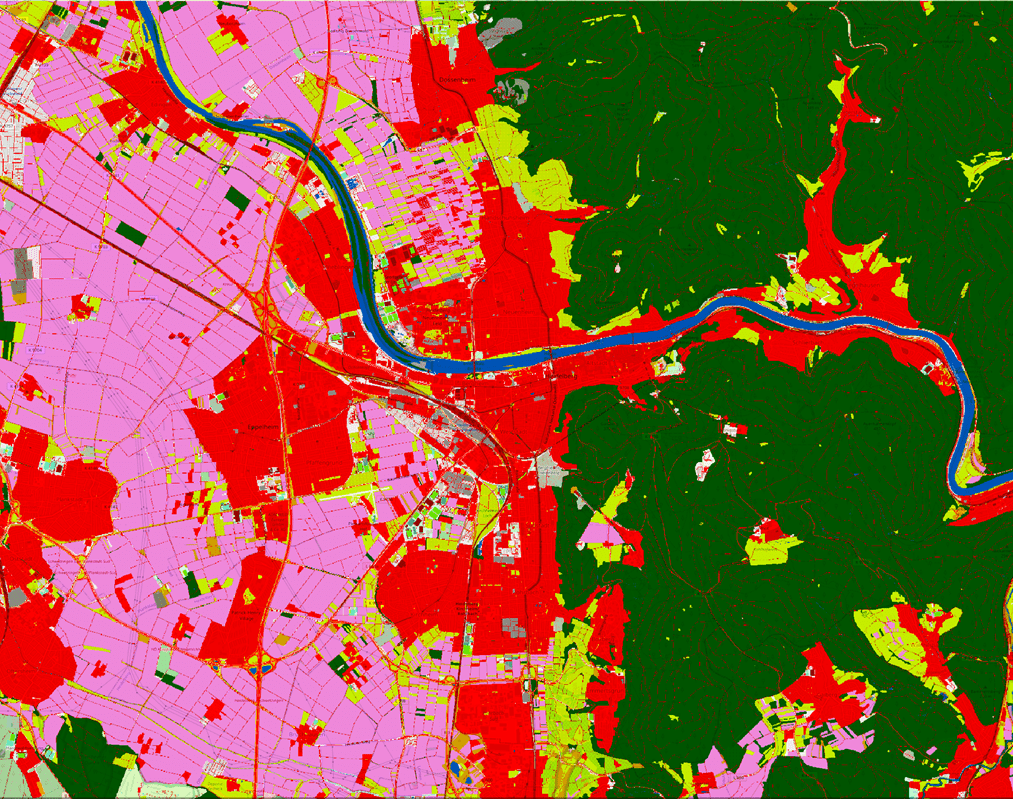
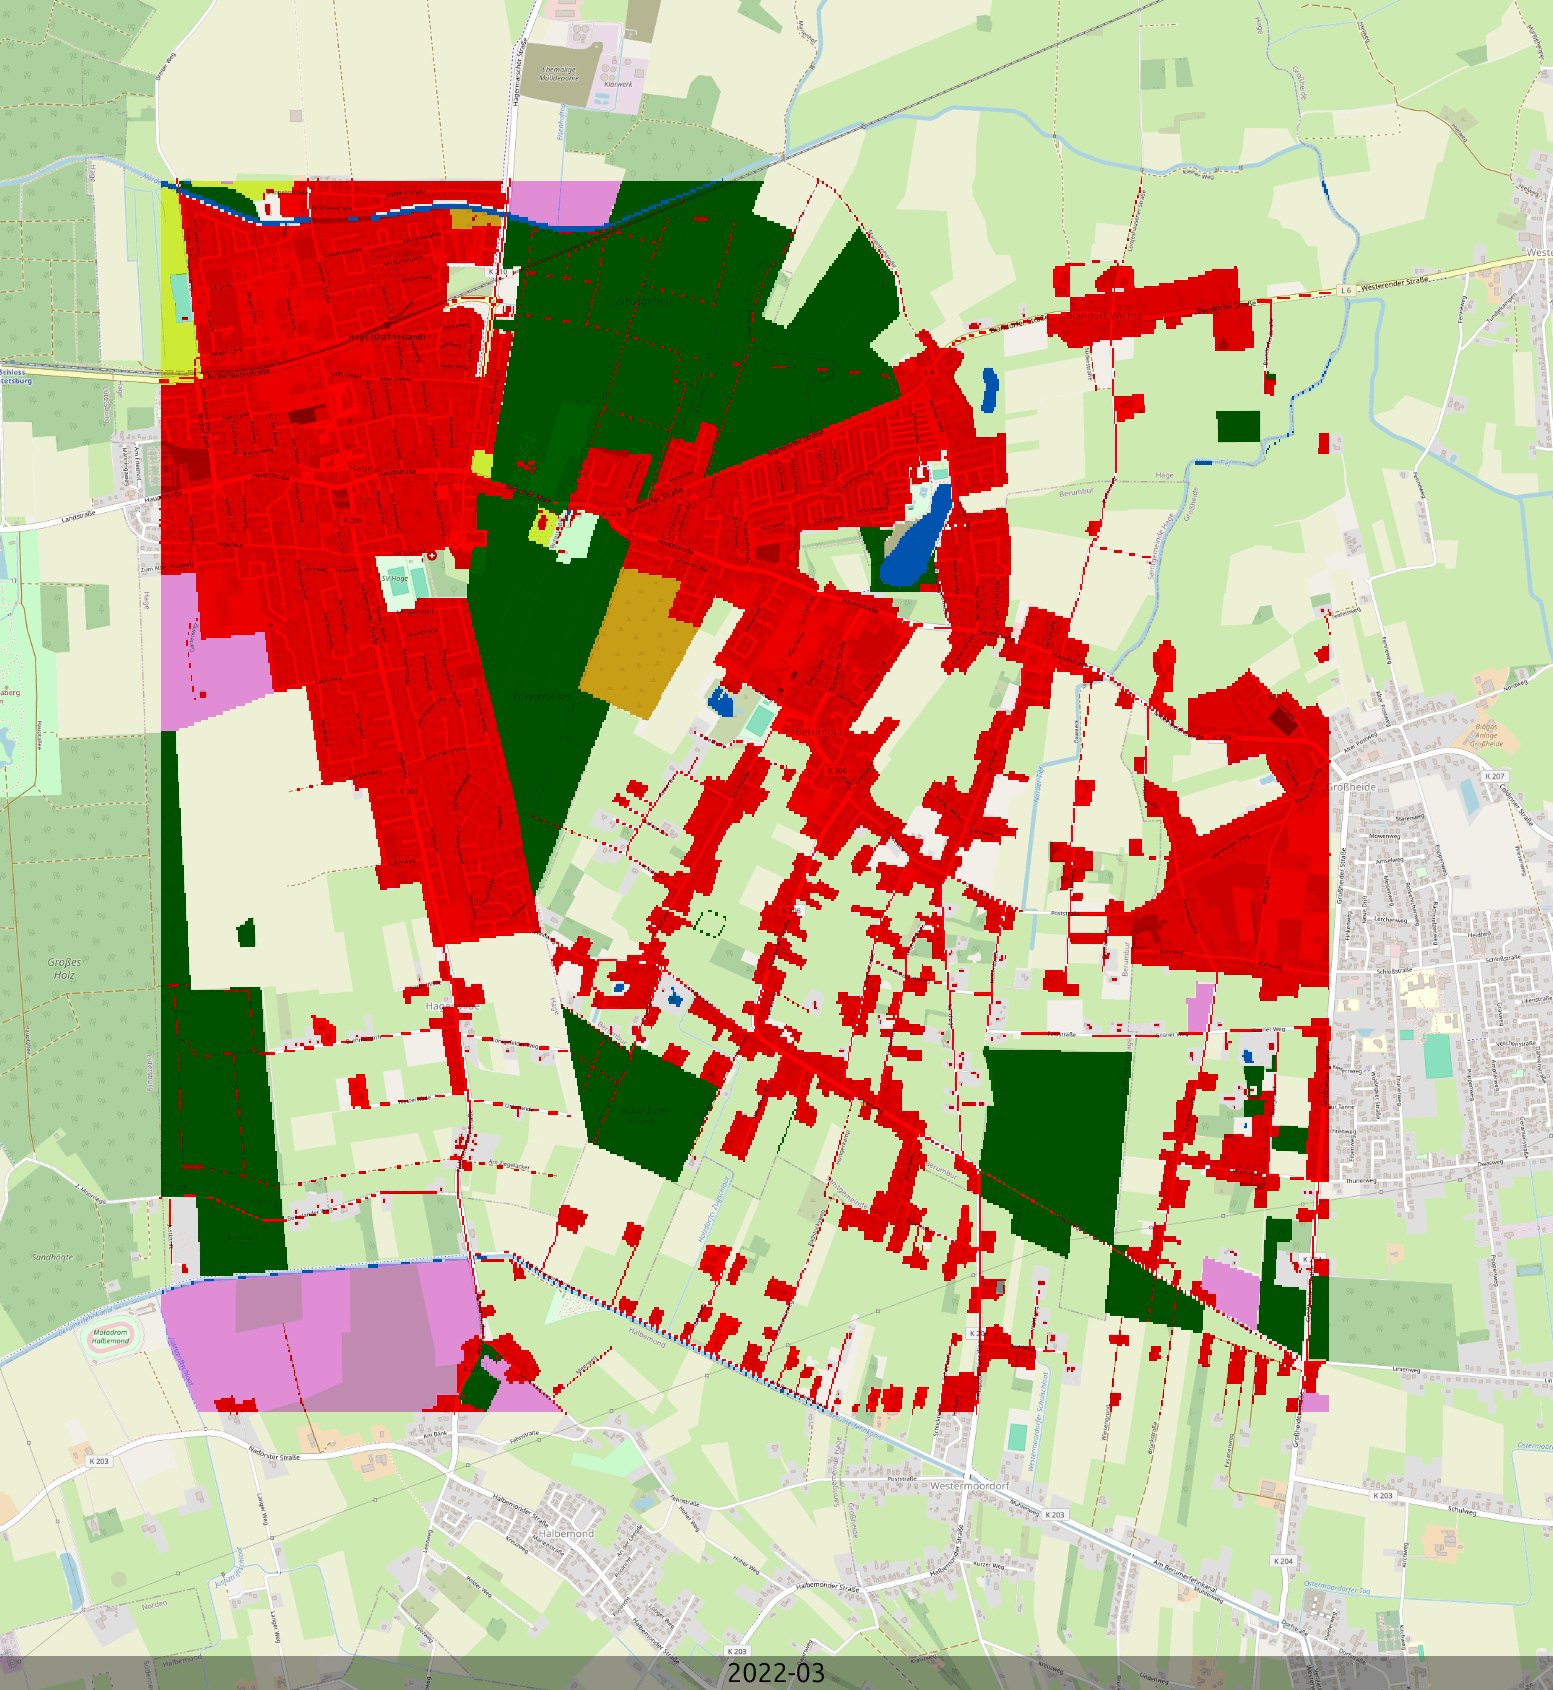
Next we looked into ways we can compare OSM changes ground reality (Satellite Imagery), so we generated a land use raster from OSM features and mapped them to the WorldCover classification scheme, which defines 11 land cover classes. This allowed us to directly compare our OSM-derived raster data with ESA’s WorldCover datasets from 2020 and 2021, which are based on Sentinel-1 and Sentinel-2 imagery.
This comparison helped us assess how well OSM captures actual land use on the ground and where differences or mismatches occur. The results showed that the OSM-based raster generally aligned with recent feature additions in the study area—suggesting that OSM data can reflect real-world land use dynamics to a meaningful degree.
However, high-resolution satellite imagery, including Planet RGB data, revealed that many of these “new” features in OSM—like farmland parcels—had already existed on the ground for some time before being mapped. This is consistent with how OSM data often evolves: contributors typically map features after they appear in the real world, sometimes with a delay of months or even years.
To get around the limitation of WorldCover—available only for 2020 and 2021—we took a slight detour. Since our goal was to compare satellite and OSM data on a finer temporal scale, we used Dynamic World, which offers more frequent updates and a similar classification system with nine land cover classes. We then adapted the process to align with the Dynamic World schema and carried out a new round of comparisons.
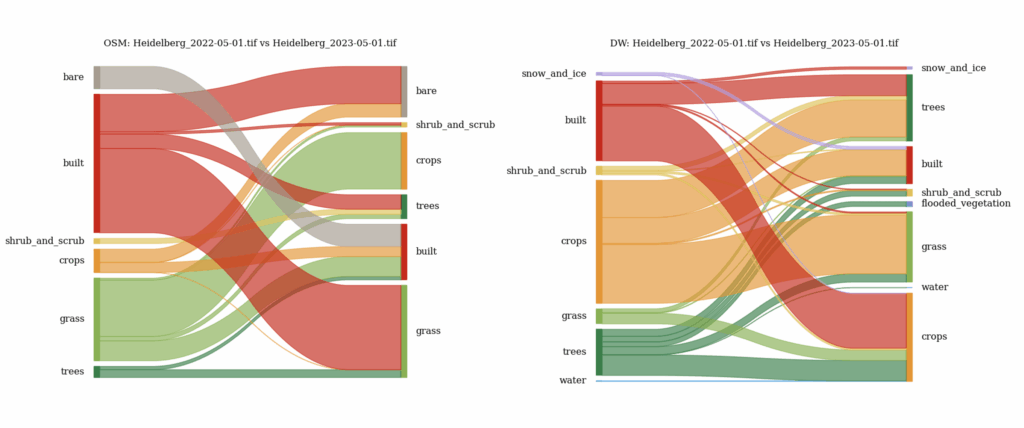
For efficient data processing, we sourced OSM data from Parquet datasets. This gave us a significant advantage in terms of speed and performance, especially when working with large-scale temporal comparisons. The next step was comparing the datasets using confusion matrices to evaluate their agreement, with a one-year offset. This one-year gap was intentional: based on our earlier observations, we assume it often takes about a year for the OSM community to map real-world changes.
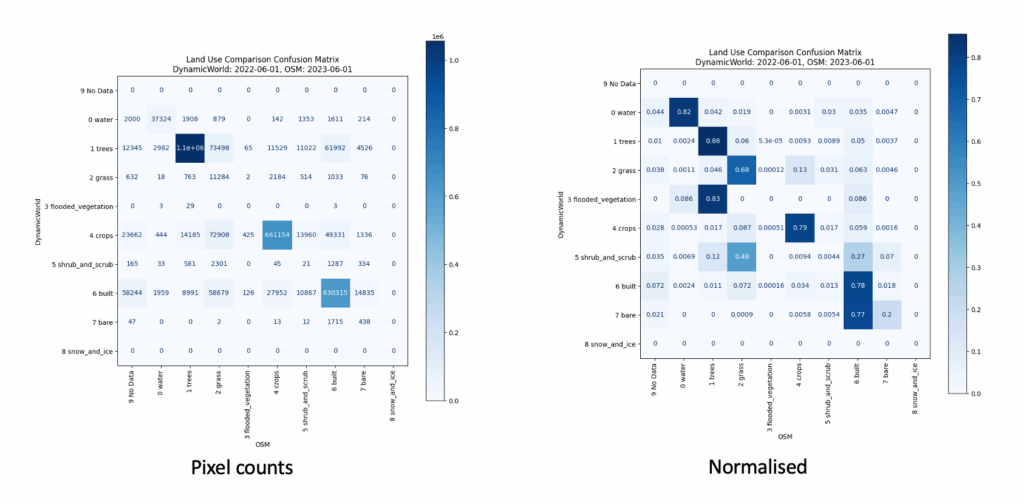
Our broader goal is to identify and define what a “change” in OSM looks like. To get there, we’re analyzing how well OSM aligns with external observations and where discrepancies occur. To explore change dynamics, we compared OSM datasets one year apart, as well as satellite-derived land cover data (from Dynamic World) over the same time span. This allows us to analyze temporal trends in each dataset independently.
With this understanding, the aim is to train a machine learning model that learns to recognize patterns of valid change in OSM. Ultimately, such a model could help detect meaningful changes as they emerge and trigger alerts or validation workflows in near real-time.
To learn more about the LaVerDi project: LaVerDi