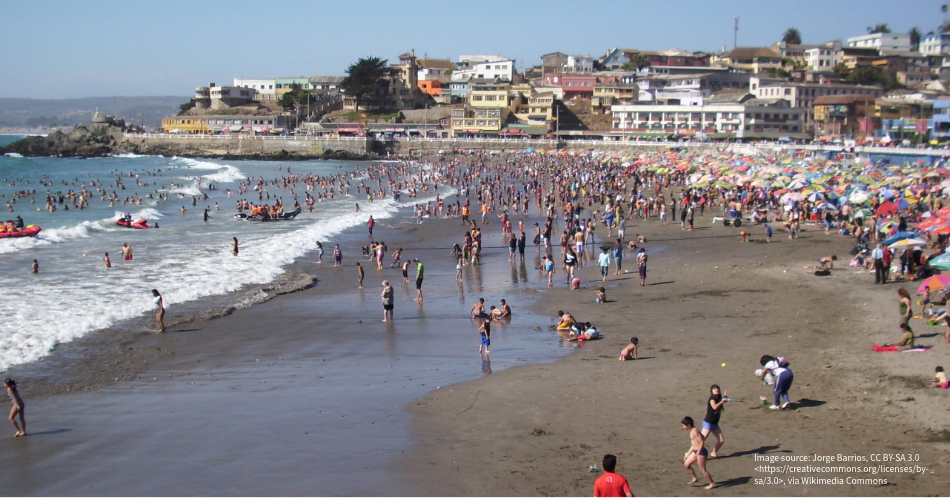
The Sketch Map Tool was used in Cartagena, Chile, to collect geographic information for effective disaster risk reduction. It is an easy-to-use tool for participatory sketch mapping through offline collection, digitization and georeferencing of local spatial knowledge.
The group mapping activity allows to identify issues associated with the risks that most concern and interests the community. The dimensions of vulnerability they recognize in their territories, historical memory related to the behavior of hazards, or also the territorial factors that contribute to strengthening community resilience in the face of disasters are examples for that. At the same time, the mapping process facilitates community empowerment through the achievement of consensuses and the identification of shared issues and strengths.
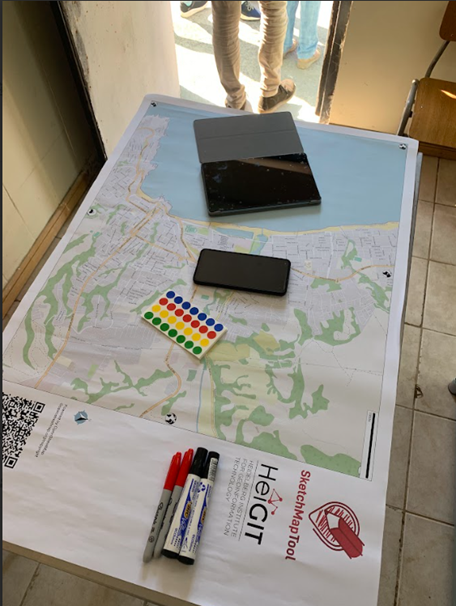
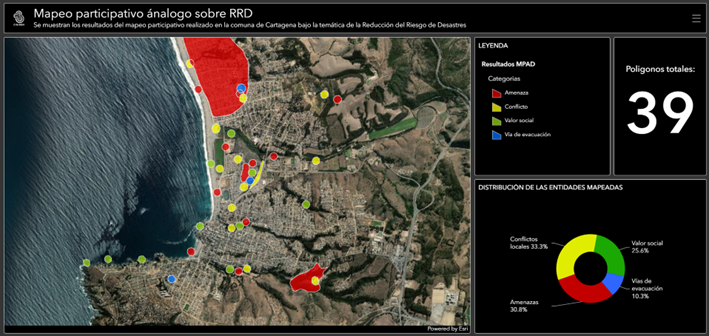
In this case, the mapping was conducted in groups. All participants marked areas of significance, risk, and resilience in four color-coded categories with stickers or markers on an A1 map. The areas were highlighted with four different color-codes:
- Community-valued sites and infrastructure (green)
- local conflicts (yellow)
- socio-natural hazards (red)
- evacuation routes and safe zones (blue)
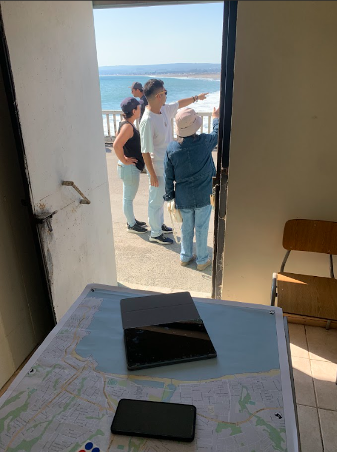
The categories were explained to the participants and they were then enabled to choose either stickers or markers of the respective color to put their markings in context and bring their knowledge to the map. A color legend on the site of the map helped participants to guide the mapping. The activity took place in the Coastal Marine Observatory which had the advantage of having a good view on the places that were to be mapped.
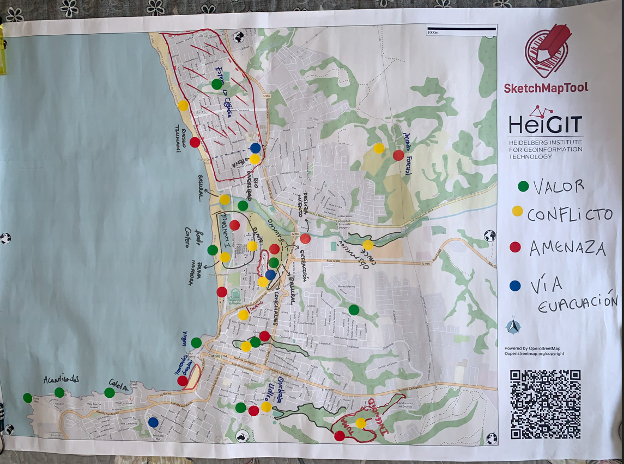
The result was a public dashboard which displayed the 39 mapped entities and their category distribution, with Local Conflicts and Threats being most common. It demonstrates the local inhabitants’ ability to generate geographic information from a comprehensive and even multidisciplinary perspective on the factors that constitute disaster risk.
The results will also be shared in the local newspapers to raise awareness. By sharing and making this geographic information publicly available, the community’s knowledge and concerns are brought into broader visibility, supporting more informed decision-making, fostering greater awareness, and strengthening local disaster risk management efforts.
More information: