Urban cycling has emerged as a central strategy in sustainable mobility planning. However, assessing and comparing cycling conditions across different cities remains a challenge. A recent study published in Sustainable Cities and Society addresses this gap by proposing a composite index that quantifies cycling readiness in thirteen European capital cities.
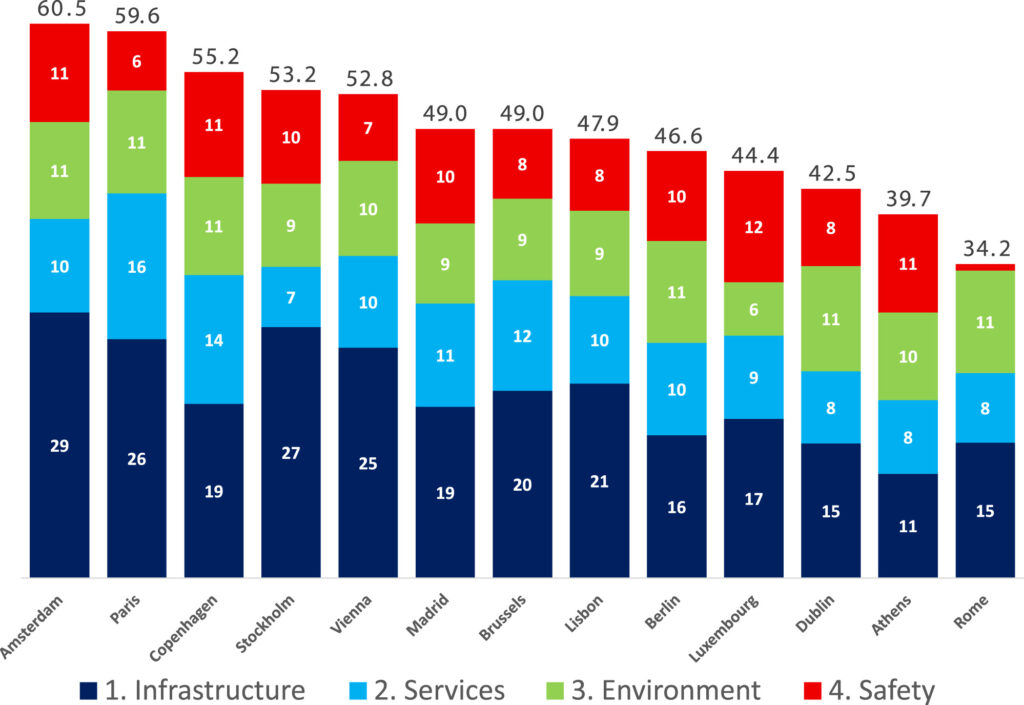
To capture the full spectrum of factors shaping everyday cycling, the BIKE Index integrates four key dimensions: cycling infrastructure, cyclist services, environmental constraints, safety and street quality. This multi-layered approach provides a nuanced picture of how well cities support cycling. The analysis relies exclusively on harmonized open datasets, primarily sourced from OpenStreetMap, and combines them with computational methods that generate a standardized set of cycling routes for each city.
openrouteservice enables the generation of consistent cycling route metrics across diverse urban contexts. The simulated routing outcomes provide comparable network indicators essential for an inter-city benchmarking.
Methods and role of openrouteservice
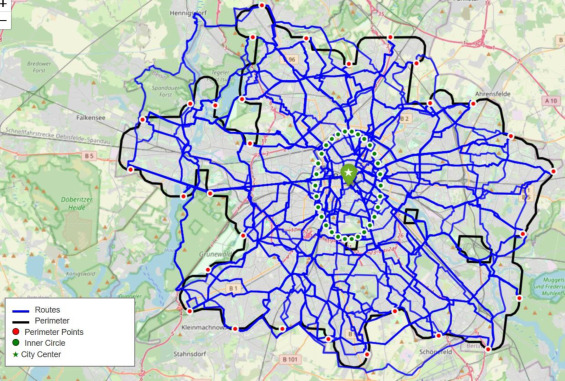
The research applies a spatially explicit workflow that synthesizes open geographic data with standardized computational analysis to derive the BIKE Index. To achieve reproducible results across cities, urban boundaries were defined and a fixed number of 210 cycling routes is generated, enabling direct comparability while avoiding biases associated with ad hoc route selection or heterogeneous data sources. Within these defined boundaries, the study integrates a wide range of harmonized datasets.
The primary spatial backbone of the analysis is derived from OpenStreetMap, which provides detailed and openly accessible representations of urban networks and facilities. These spatial data are complemented by statistical inputs from Eurostat and climatic information from the E-OBS dataset, allowing the index to account for broader contextual factors influencing cycling conditions.
A distinctive feature of the methodology is the explicit incorporation of route-level analysis to reflect how cyclists experience the urban network in practice. To this end, the researchers generate a standardized set of 210 cycling routes for each city using openrouteservice. By applying the same routing procedure across all case studies, the analysis captures differences in network structure, connectivity, and directness in a reproducible manner. This approach directly provides insight into the functional performance of cycling networks.
From the simulated routes, a range of route-based indicators is extracted, including measures related to distance and network characteristics that serve as proxies for cycling efficiency and accessibility. These indicators are then integrated with the broader set of spatial and statistical variables, enriching the multidimensional structure of the BIKE Index with performance-oriented information derived from real routing conditions.
The final step of the methodology involves synthesizing all component indicators into a composite index that represents overall bikeability and cycling readiness. This composite measure enables systematic ranking and comparison among European capitals.
Conclusion
The BIKE Index reveals notable disparities in cycling conditions across European capitals, with high scores indicating environments where infrastructure, services, safety, and environmental constraints align to support daily bike use. The study offers a scalable and transparent index for urban bikeability, providing planners and policymakers with actionable insights for sustainable mobility enhancement.
Building on this city-level perspective, tools such as the Climate Action Navigator complement index-based assessments by offering detailed, spatially explicit insights into bikeability, including information on path quality and network characteristics at a higher resolution.
Reference:
Quintero Gómez, A., & Calvo-Bascones, P. (2026). BIKE (Bicycle Integration Key Elements) Index: Benchmarking urban bikeability and cycling readiness. Sustainable Cities and Society, 136, 107096. https://doi.org/10.1016/j.scs.2025.107096