Our ohsome R package has finally landed on CRAN! The package grants access to the power of the ohsome API. This makes it even easier to analyze the rich data source of OpenStreetMap (OSM) history from R. You can specify your own temporal, spatial and/or thematic filters and request aggregated statistics on the evolution of OSM elements. Using established classes for spatial data in inputs and outputs, ohsome integrates particularly well in workflows with other tools for spatial analysis and visualization in R.
The package can now be installed directly from CRAN:
install.packages("ohsome")
Let’s look at a little example of what you can do with the ohsome R package. Here, we request monthly values for the total length of bus routes on OSM within the bounding box of the city of Heidelberg from the ohsome API and quickly plot the results:
library(ohsome)
library(ggplot2)
library(tmaptools)

bb("Heidelberg") |>
    ohsome_elements_length(
        filter = "route=bus and type:relation",
        time = "2008/2023/P1M"
    ) |>
    ohsome_post() |>
    ggplot(aes(x = timestamp, y = value/1000)) +
    geom_line() +
    scale_y_continuous("Length of bus routes (km)", labels = scales::comma) +
    xlab(NULL)
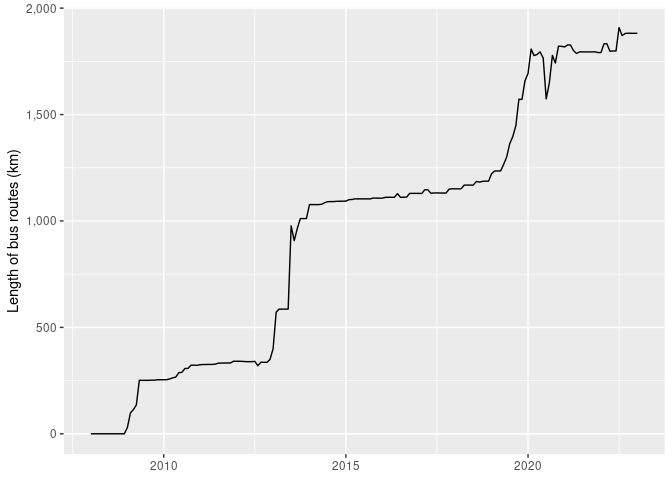
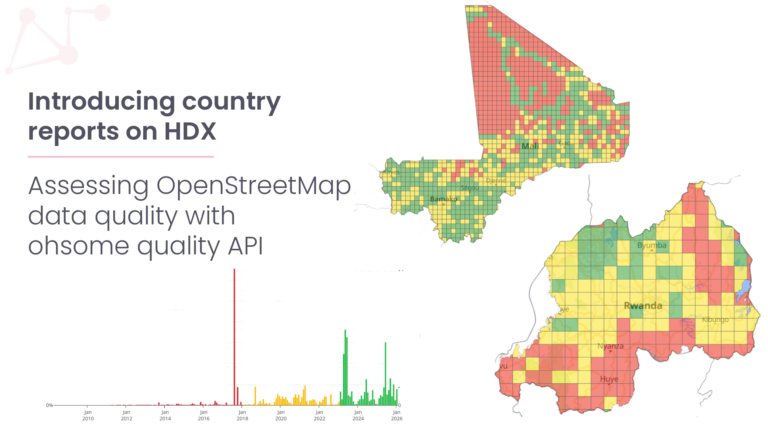
Having easy access to aggregated values like these is particularly useful in intrinsic quality analysis of OSM data, e.g. for an assessment of mapping saturation as an indicator for object completeness. Of course, you can do a lot of more amazing stuff with ohsome! For getting started, have a look at the package’s README or call its vignette with vignette("ohsome").
Don’t worry if you’re not an R user, though. There’s also ohsome-py for Python, the ohsomeTools QGIS Plugin and the ohsome Dashboard to facilitate access to the ohsome API.