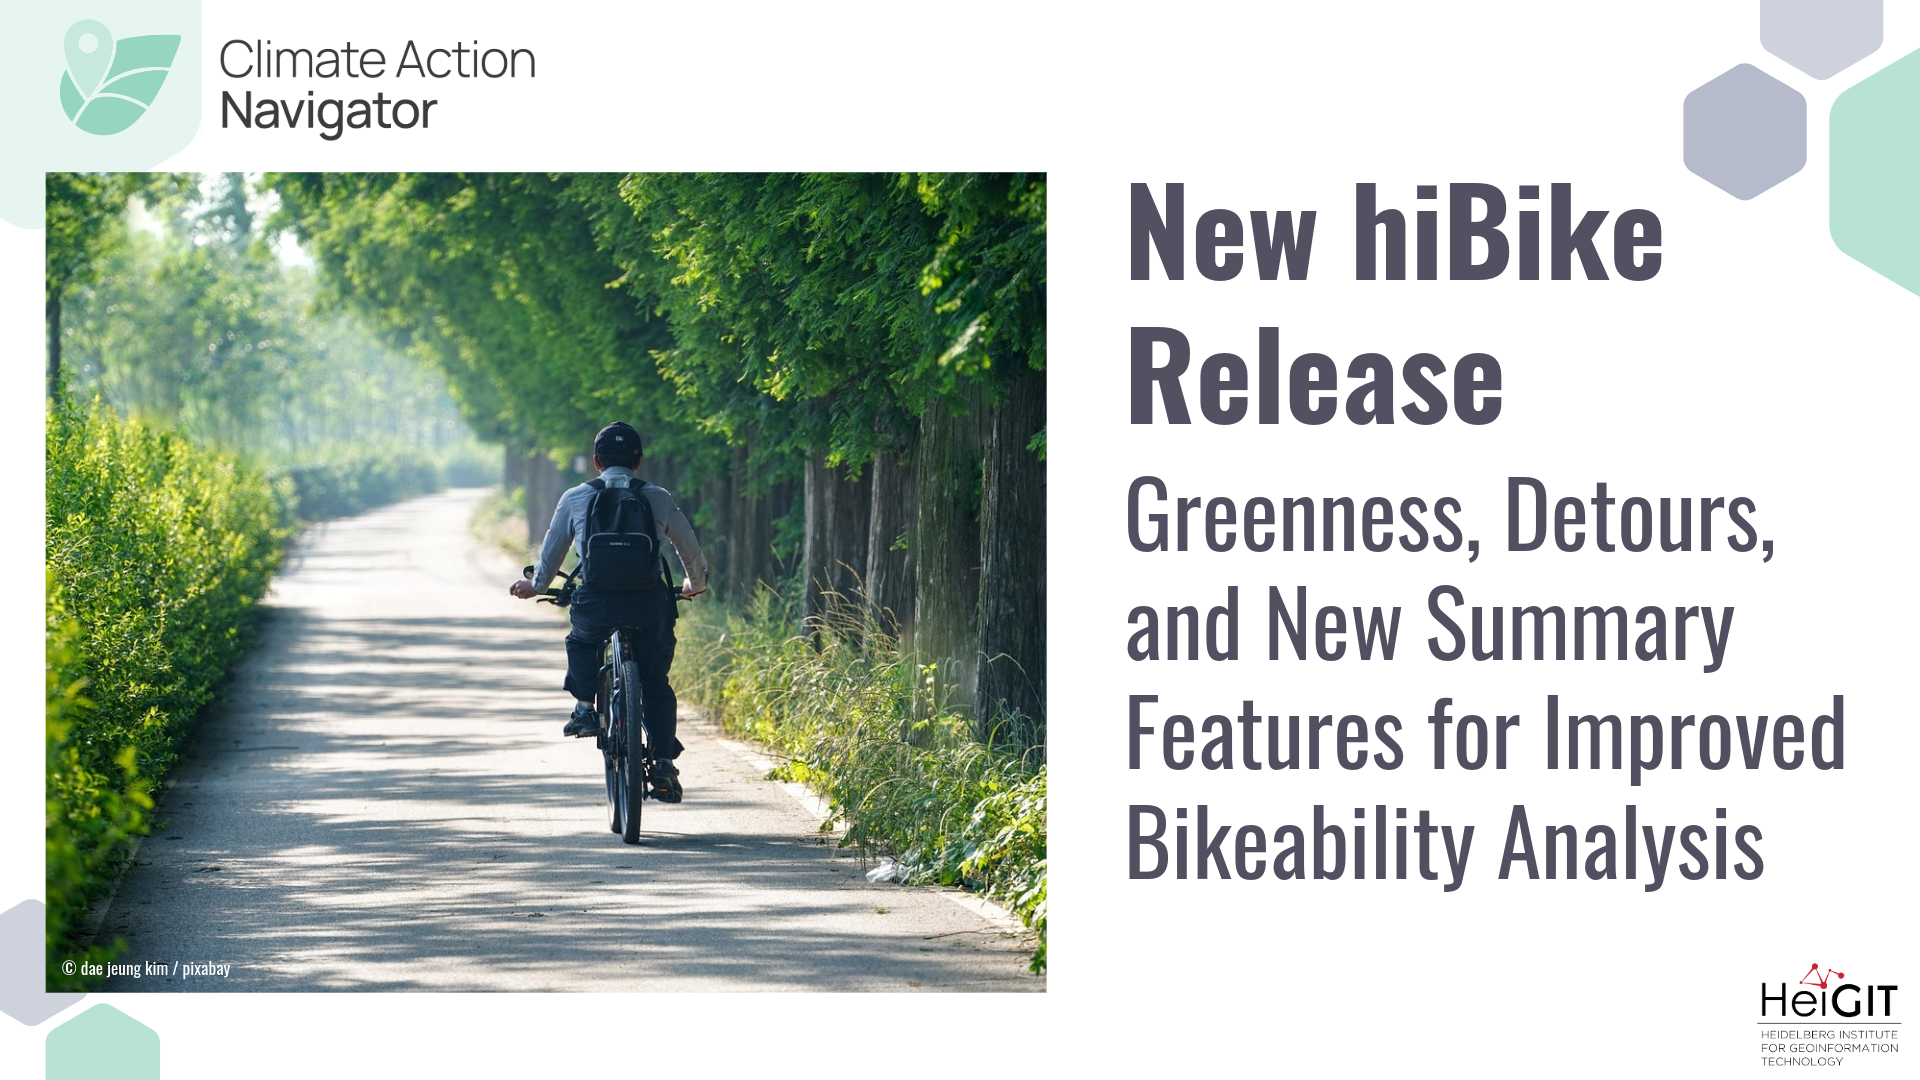
Assess Bikeability with hiBike
hiBike is a key assessment tool of the Climate Action Navigator (CAN) for analyzing the bikeability of cities and towns. It evaluates how bike-friendly the urban street infrastructure is by using indicators co-developed with real-life users like the Radlobby Austria.
We have now released a new version of hiBike, which adds two new indicators (Greenness and Detour Factors) to the preexistent ones (Bikeable Path Categories, Dooring Risk, Path Smoothness, and Surface Types). Moreover, we have extended the summary statistics to provide more actionable information for stakeholders such as NGOs, city administrations, and citizens’ initiatives to identify strengths and gaps in the cycling infrastructure of their cities.
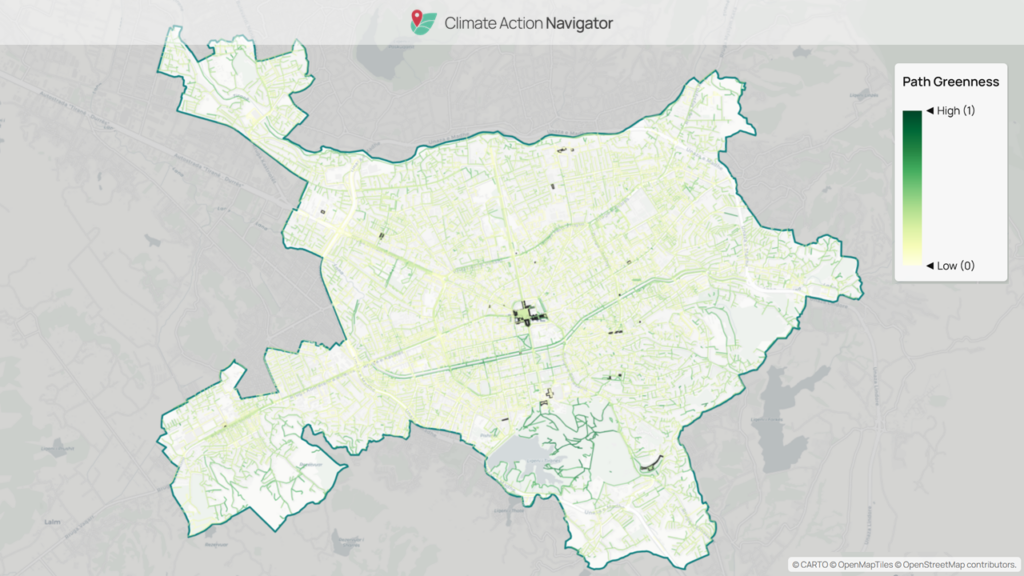
Greenness: How Much Greenery Is There on My Cycling Path?
Cycling is generally more enjoyable when there is vegetation (such as trees or parks) or water (such as a river or pond) nearby. We take this into account by adding a “greenness” indicator to our bikeability assessment tool. The new greenness indicator aggregates the Normalized Difference Vegetation Index (NDVI) to show vegetation presence within a small buffer around bikeable paths. This feature enables users to identify areas where greenness enhances comfort or where it may be lacking.
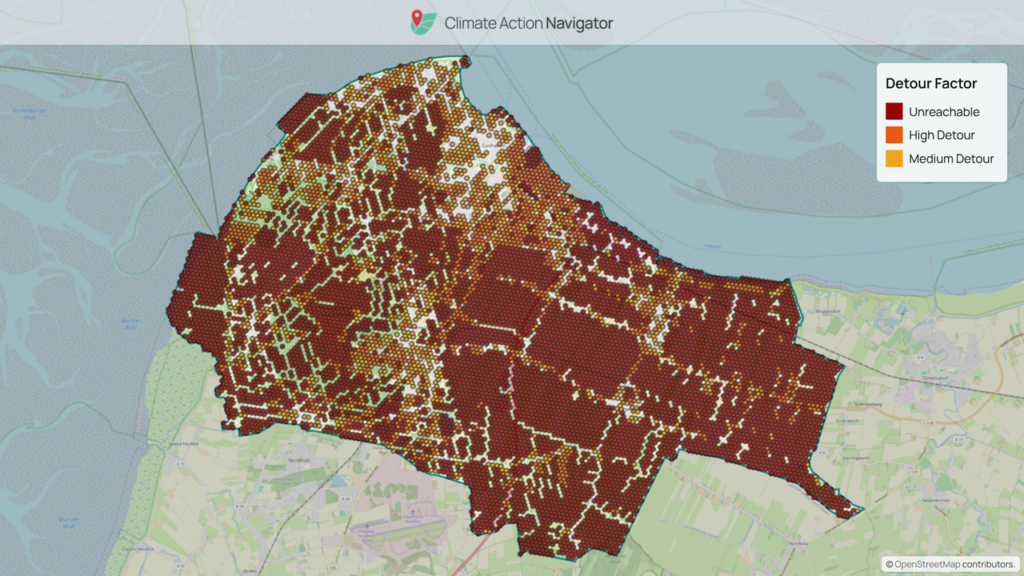
Detour Factors: Can I Take the Shortest Route to My Destination?
When cycling to a desired destination, we generally wish to take the shortest route, avoiding lengthy detours as much as possible. Detour factors highlight areas where a long detour is necessary or reaching a neighboring cell is impossible for cyclists. The latter case indicates that the cycling infrastructure is missing (or that it is not mapped). For city planners and advocacy groups, such insights are essential for identifying structural barriers and prioritizing interventions.
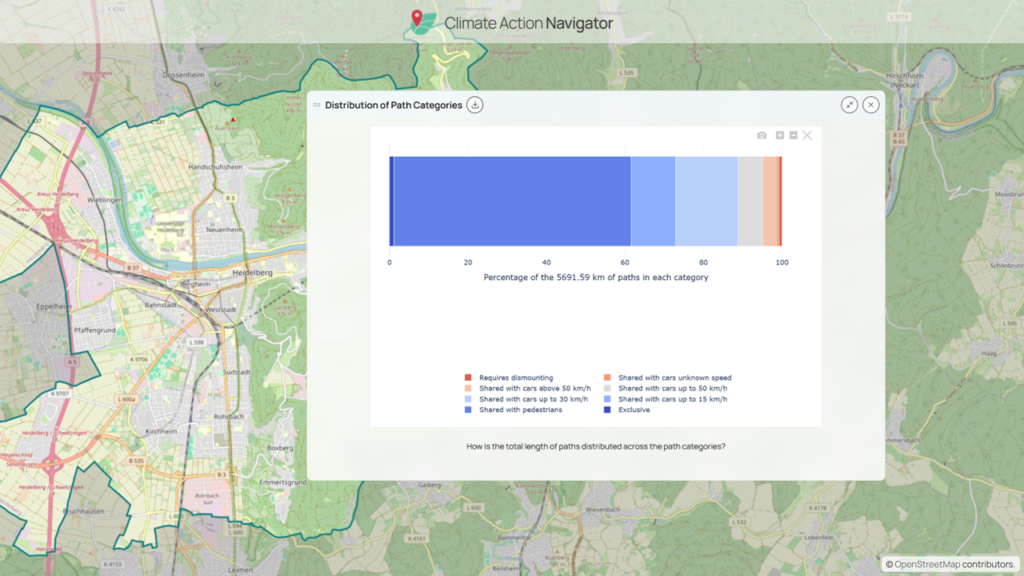
Summaries: Strengthening Data Transparency and Quality
The new hiBike version introduces extended summary statistics that give more detailed information on the percentage of paths in each category, including path-sharing characteristics, surface quality, and greenness. Except for greenness, all these summaries function as a data quality check, helping users understand how well cycling infrastructure is mapped in their area of interest. The greenness summary provides the user with a handy overview of the overall greenness of the selected area.
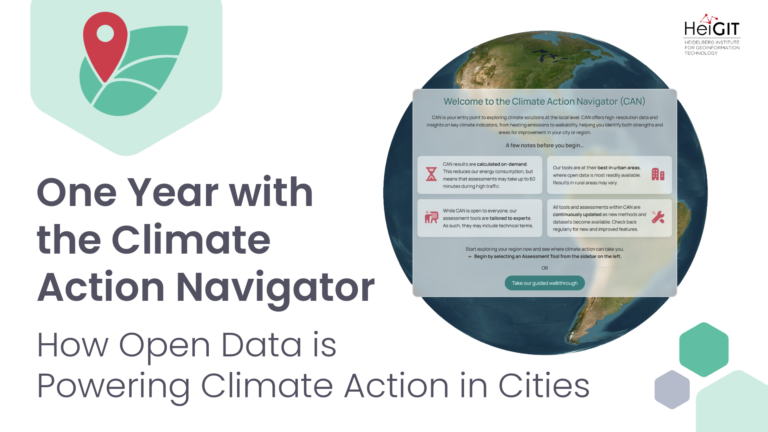
The Climate Action Navigator
The current enhancements to hiBike are part of a broader development of the Climate Action Navigator, which already delivers high-resolution assessments on climate-relevant topics such as urban walkability, cities´ CO2 budgets, residential heating emissions, land consumption, and emissions linked to land use changes.
Whenever possible, CAN uses freely accessible data (like OpenStreetMap and satellite imagery) and open software tools, thereby ensuring accessibility, broad applicability, and adaption opportunities. CAN´s assessment tools aim to help stakeholders identify both strengths and gaps in climate mitigation across sectors. By visualizing data at street-level resolution, interventions and improvements can be targeted and consider the specific local context.
Assess how your city or district is doing with the Climate Action Navigator: https://climate-action.heigit.org/webapp/dashboard