New Heating Emissions Indicators
Keeping our homes warm is a major source of CO2 emissions. In Germany, around three quarters of all households still rely on burning fossil fuels like natural gas and oil to stay warm, which makes residential heating a key sector to mitigate climate change. To better understand the problem and tackle it locally, we need accurate emissions data at the finest resolution possible.
The Heating Emissions assessment tool estimates CO₂ emissions from heating in residential buildings with a precision of 100 meters. The heating emissions can be shown in absolute numbers (kg/year) and per capita.
The latest version of Heating Emissions, launched in November 2025, now shows additional information about the construction year and the energy carrier of the buildings. The time period in which a residential area was built is a crucial factor for energy consumption, as older buildings tend to have worse insulation and require more energy to stay warm. The energy carrier used for heating is then a key element in determining CO2 emissions, as different energy sources have a varying climate impact.
These new indicators are useful to understand the reasons behind different emission levels, as they provide at-a-glance insights on the factors responsible for different heating emissions in different neighborhoods. They help local stakeholders understand the emission reduction potential in different areas and what needs to change locally to cut emissions effectively.
Use Case: Heating Emissions in Kalbach-Riedberg (Frankfurt am Main, Germany)
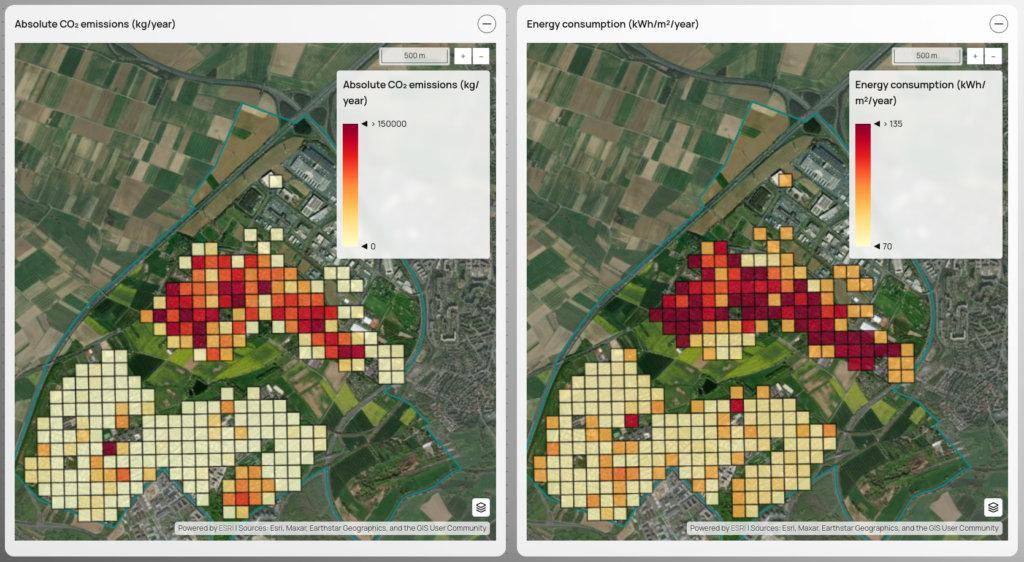
Let’s take a look at the district Kalbach-Riedberg in Frankurt am Main, Germany. The Heating Emissions assessment tool provides maps showing annual estimates of CO2 emissions and energy consumption in 100 x 100 m grid cells.
In Figure 1, we can see that there is a neighborhood with relatively high CO2 emissions, where several grid cells have CO2 emissions of about 150,000 kg/year. Only a few steps away, there is another neighborhood where most grid cells have zero emissions. Why is there such a striking difference?
Taking a look at the estimated energy consumption, we can see that the neighborhood with the low emissions also has a lower energy consumption. However, the estimated annual energy consumption in this neighborhood is still above 70 kWh per square meter in all grid cells. So how can most grid cells have zero emissions?
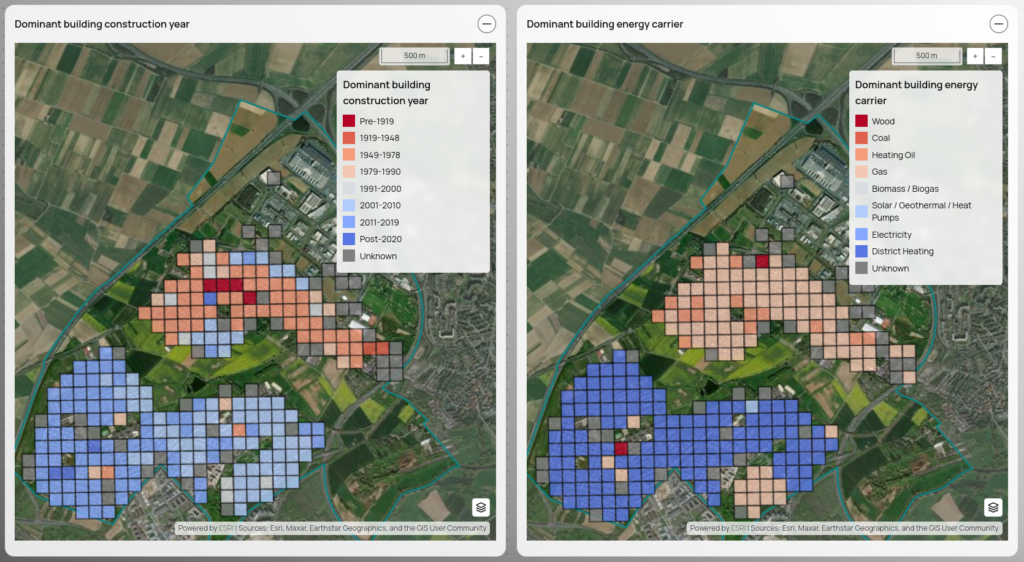
The new indicators can provide further insights. If we look at the building construction year (Figure 2), we can see that the neighborhood with the higher emission estimates is mostly composed of older buildings constructed between 1949 and 1978. Buildings constructed in this period are often not well insulated, which explains their higher energy consumption. On the other hand, the lower energy consumption in the other neighborhood can be explained by its newer buildings which were mostly built after 2000, when the insulation standards were already much higher. But as we have seen in Figure 1, these buildings still consume energy for heating, so we still don´t know why they seem to have zero emissions.
On the right side of Figure 2, we can see the dominant energy carrier in each grid cell. In the neighborhood with the older buildings and higher energy consumption, gas is the most common energy carrier. So the higher emissions in this neighborhood are a result of higher energy consumption caused by the lower insulation in the predominantly older buildings and the burning of gas to keep them warm. In the other neighborhood, the energy carrier that heats most buildings is district heating. When buildings are connected to a district heating network, the heat is generated in a central district heating plant, not in the building itself. Thus, no emissions are generated in the building itself, which is why our map shows zero emissions for these buildings.
It is worth noting that even though their energy consumption is much lower due to their better insulation, emissions may still be generated to keep these buildings warm if fossil fuels are burned in the district heating power plant. However, since the aim of the Heating Emissions assessment tool is to show emissions directly where they occur, these buildings are shown to have zero heating emissions.
Why do we show it this way? For buildings connected to district heating, it is not the homeowner who controls the heating energy source. In this case, the district heating provider is the relevant stakeholder to reduce emissions, e. g. making sure that the heat is generated using renewable energy sources.
The Climate Action Navigator
The current enhancements to Heating Emissions are part of a broader development of the Climate Action Navigator, which already delivers high-resolution assessments on climate-relevant topics such as urban walkability and bikeability, cities´ CO2 budgets, land consumption, and emissions linked to land use changes.
Whenever possible, CAN uses freely accessible data (like OpenStreetMap and satellite imagery) and open software tools, thereby ensuring accessibility, broad applicability, and adaption opportunities. CAN´s assessment tools aim to help stakeholders identify both strengths and gaps in climate mitigation across sectors. By visualizing data at street-level resolution, interventions and improvements can be targeted and consider the specific local context.