Here we go again: The first #ohsome blog post of 2021. This time, one of our new student assistants Sarah was dealing with street networks and their quality in order to find out which of the selected regions has the most detailed info in OpenStreetMap as well as the best data consistency over the past 10 years. The regions of interest are different european cities of roughly the same size and population (Bern, Bordeaux, Luxembourg, Maastricht & Regensburg).
We have conducted two analyses on the given areas of interest: relative length of the street network (length of streets divided by size of region) and an attributive completeness analysis looking at the length of streets having information about the speed through the tag “maxspeed” compared to those without. In each of the two analysis, we compared the regions with each other. At the end of the second analysis coming in another blog post next week, we will then crown a winner. Let’s jump right into the first analysis!
Data:
The necessary OSM data is downloaded as usual from our global ohsome API instance. You can get the spatial data set used as the area of interest in our requests via this website. There is also a GeoJSON-file in the snippet that you can find here, which already contains the specific boundaries used in this analysis, as well as the used cURL requests and visualizations.
Request:
The first request gives the evolution of the density of the street network within the boundaries of 5 cities over the past 10 years. You are going to need to send a POST request for that dataset. We chose csv as output format as it is easy to load and further process in e.g. spreadsheet programs.
Parameters:
format = csv
filter = type:way and (highway in (motorway, motorway_link, trunk, trunk_link, primary, primary_link, secondary, secondary_link, tertiary, tertiary_link, unclassified, residential, living_street, pedestrian) or (highway=service and service=alley))
time = 2010-12-01/2020-12-01/P1M
Data exploration:
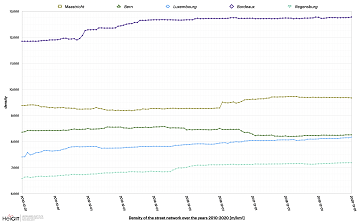
The first graphic shows the development of the density of the street network in each city over the years 2010-2020.
When looking at the overall development of density values for Bordeaux having the highest values in our analysis, one can conclude that the starting value was relatively low, though the highest in comparison to all other examined regions. The dataset shows moderate growth until April 2012 with a minor drop in August followed by a rather strong increase until December 2012. More or less stable values have set in in July 2014.
The meeting point of the Maastricht dataset with the mean density value (9419.37 m/km2) takes place between December 2016 and January 2017. Before that the values are below said mean and have been over it ever since. A minimum density was reached in April of 2014 with values continuously decreasing with some stronger ‚jumps’. Subsequent to this a short phase of increasing values which ends up in a stagnation around the winter months of the same year. The trend remains positive until it stagnates in July 2018 and displays only a slight decrease for the rest of the time.
The dataset for the city of Bern, displayed in a green line with triangles, also begins with a density below the mean value (8398.486 m/km2) but has a quick development to values above mean in February 2011 already. These higher values, including the maximum values from July 2013 to May 2015, remain consistent until about August 2017 from which they fall and stay below mean again. The minimum values were reached in January of 2019 and only increased very slightly ever since.
For Luxembourg, represented by the blue line with circles, one can basically record a steady increase with a few minor collapses and a bigger jump between January and February 2011 and a phase of stagnation around May 2013. The last city we looked at was Regensburg which mainly had two phases of density development that were separated by a stronger increase during June 2015 – May 2016. The density values have been above mean (6949.04 m/km2) ever since August 2015. There have been some data imports for the cities, e.g. in May 2015 by the Vermessungsamt der Stadt Bern, but they do not appear to have a significant impact on the density data.
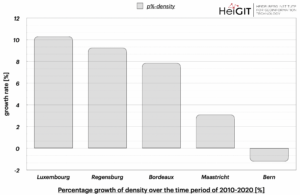
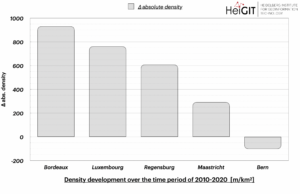
For the second part of the exploration, we created two bar charts, which display the percentual growth (top graphic) of each city from the first to last timestamp, as well as the absolute delta values for each city (bottom graphic):
As Bern is the only city with a negative development, it has the lowest value in both graphics. This probably indicates that the street network of this city was already well developed prior to the starting timestamp of this analysis. We chose to visualize both, the percentual and absolute numbers, as the percentage-growth was more suitable for looking at the individual development of each city, whilst the absolute numbers are good for a comparison of the overall development. This becomes especially obvious when looking at Bordeaux, which only has a moderate individual development but in context of absolute numbers it is the front runner of all cities.
User data:
We have also conducted a user analysis subsequent to the analysis of the density values and their development. The main outcome of said analysis was that there appears to be no connection between the differences in the density values in regards to the number of active users doing any kind of edits (create, modify, delete) on the streets. Nevertheless, the following bar chart gives you an overview on the min, mean and max values of the numbers of users for each city using again a monthly resolution. The highest number of users in one month was reached in Regensburg in June 2020 with 28 users and the lowest number was reached in Maastricht, where there wasn’t any activity on said streets in June of 2012.
Ranking
As we have said it initially, here you see a ranking of the five cities based on the analyzed data:
Overall density of street network
- Bordeaux
- Maastricht
- Bern
- Luxembourg
- Regensburg
Background info:
the aim of the ohsome OpenStreetMap History Data Analytics Platform is to make OpenStreetMap’s full-history data more easily accessible for various kinds of OSM data analytics tasks, such as data quality analysis, on a regional, country-wide, or global scale. The ohsome API is one of its components, providing free and easy access to some of the functionalities of the ohsome platform via HTTP requests. Some intro can be found here:
-
ohsome general idea
-
ohsome general architecture
-
how to become ohsome blog series
-
how spatial joins queries work in the OpenStreetMap History Database OSHDB

