
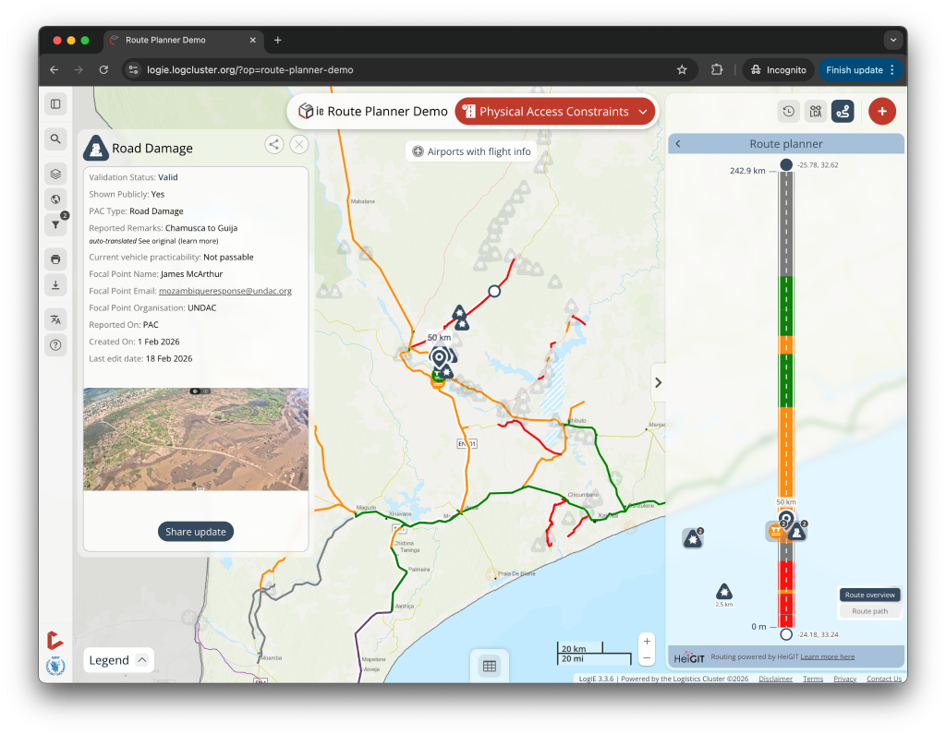

Getting supplies, staff, and equipment to the right place is a challenging task under extreme conditions, and it depends on knowing whether the road network is still passable. After a flood or an earthquake, roads may be washed out in places, slowed by debris, restricted to lighter vehicles, or dependent on a bridge that may or may not hold. Standard routing tools do not account for these dynamic changes, so the travel times they return no longer reflect realities on the ground.
Instead of relying on static, binary open or closed assumptions, SURE-PATH translates detected damage and environmental uncertainty into travel costs that rise in proportion to how likely a road is to be impassable. The project combines satellite imagery with OpenStreetMap, street-level photos, and field reports from partner organizations to update road conditions, providing more accurate travel times inside openrouteservice. In routine periods the system enriches the road network with information that is usually missing, such as surface type, width, and flood exposure. When a shock event occurs, it focuses on priority corridors and updates them. SURE-PATH does not replace existing navigation and routing systems. It adds the road information those systems lack in crisis settings, and it supports planning with travel times that carry an honest margin of uncertainty.
The work runs as an 18-month project with the WFP-led Logistics Cluster and the German Red Cross, and aims to deliver a working demonstrator.
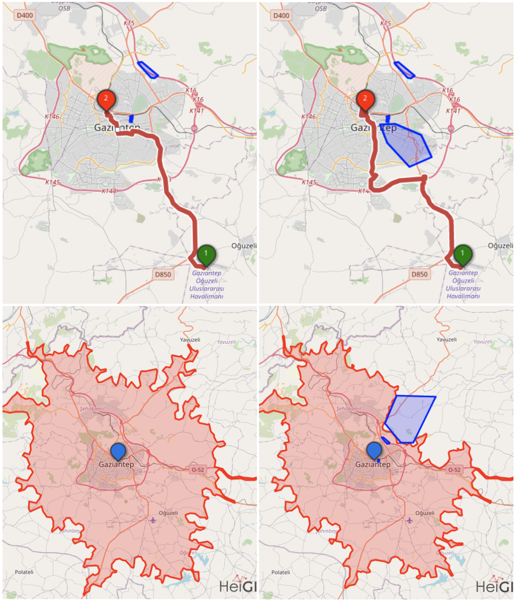
Current systems are binary and handle disruption by blocking an area entirely. A corridor that is passable at reduced speed is then excluded from planning altogether, which produces long detours and slows down the response.
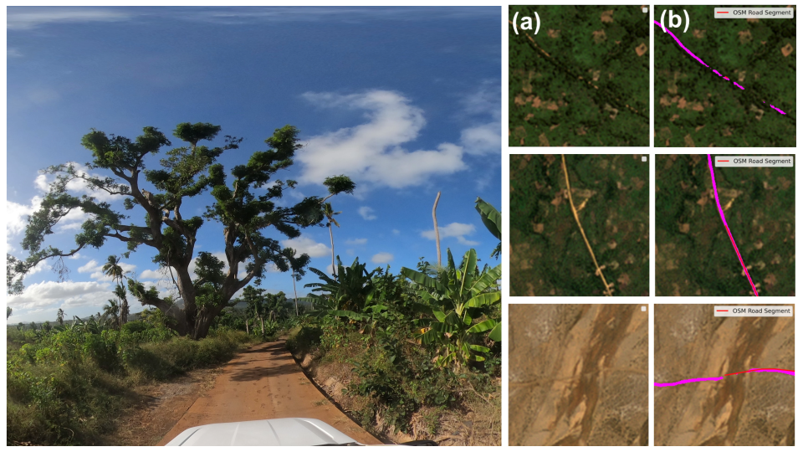
In many operating environments, attributes such as surface, width, bridge load limits, and seasonal passability were never recorded, or were recorded years ago. Local reporting after an event is often sparse, so planners work from assumptions rather than evidence.
Alerting services, rapid mapping products, and commercial flood extent layers show what has happened and where. Yet, operational planning also needs an estimate of how much capacity a road has lost and how much longer the journey now takes.
Models trained on infrastructure in one region perform poorly in others, because road materials, settlement patterns, and land cover differ. Applying an analysis in a humanitarian operating environment therefore requires methods that remain reliable where local reference data is scarce.
Commercial satellite tasking cannot be ordered routinely across whole countries. Any workable system has to decide carefully when detailed imagery is worth the cost and when open data is sufficient.
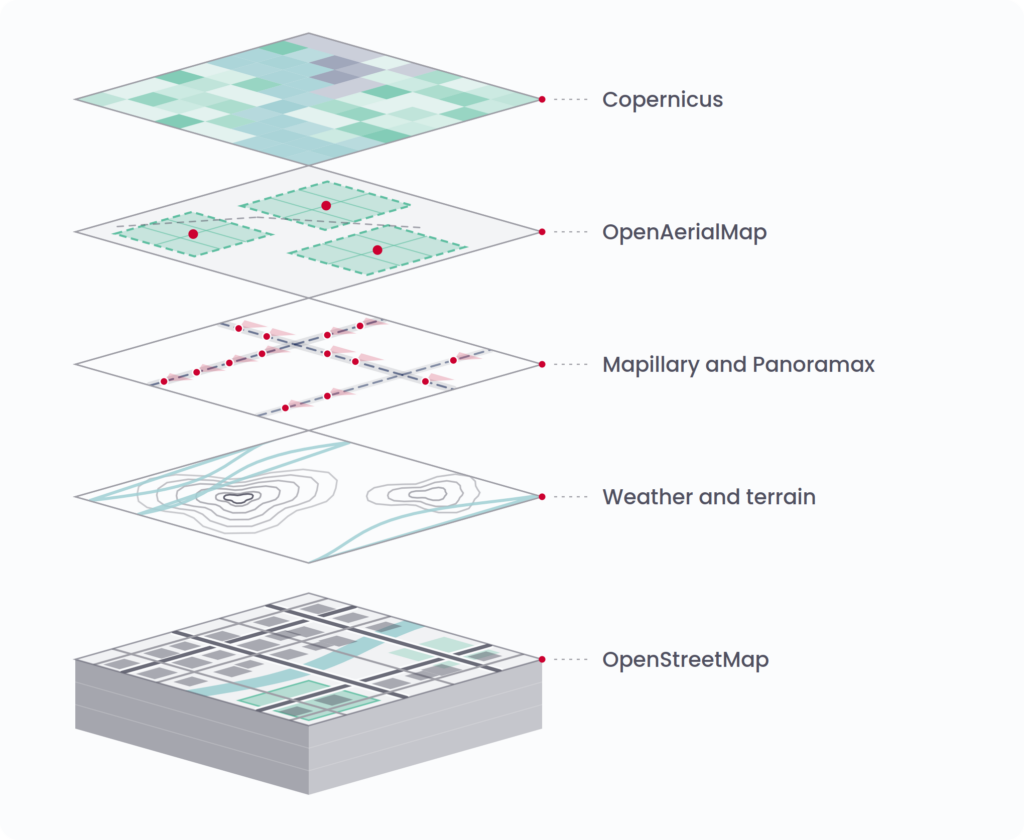
Before a crisis, the system builds an enriched picture of the road network from freely available sources. Copernicus satellite imagery, weather and terrain data, OpenStreetMap, street-level photos from Mapillary and Panoramax, and open drone imagery from OpenAerialMap are combined to estimate attributes such as surface type, width, flood susceptibility, and how critical a given segment is as a bottleneck. This baseline runs continuously and gives planners a better starting point.
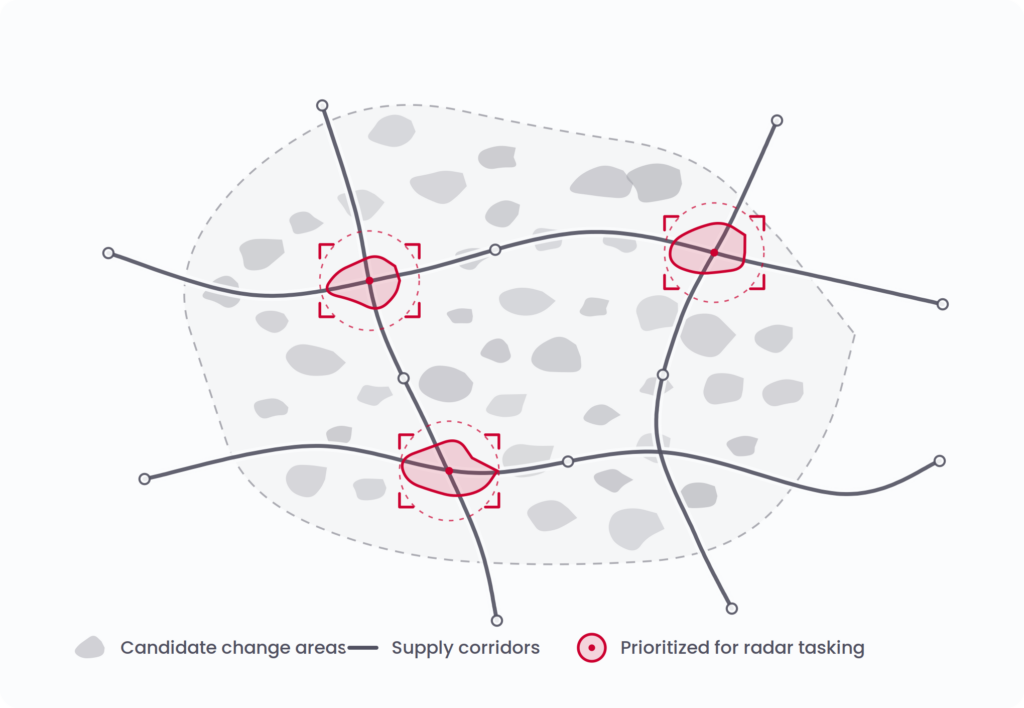
When a hazard occurs, the system screens for what is different. Hazard warnings, anomaly indicators derived from satellite data, sensor thresholds, and field reports are combined to flag areas of likely change across a wide region. These areas are then intersected with the corridors and bottlenecks, so attention goes to the places that affect delivery.
Only the highest-priority locations are escalated to detailed observation. Commercial radar satellites can see through cloud cover and at night, which matters during storms and floods when optical imagery is unusable. Ordering that imagery for priority areas keeps the approach affordable.
The observations are translated into travel costs on individual road segments in openrouteservice. The system raises the cost of using it in proportion to the confidence that it is degraded. A route returns an expected travel time together with a plausible range and the accumulated risk along the way. Every adjustment is logged with its source, so a planner can see that a segment was penalized because of a radar-derived flood mask, a surface class from street-level imagery, or a report from a colleague in the field.
The routing results reach users through interfaces built for logistics work rather than through a research prototype. This includes reachability areas showing what can be served within a given time, adaptive travel time ranges for convoy planning, and assessments of critical bottlenecks. The components are co-designed with the partner organizations and integrated into the systems they already use, including the WFP LogIE platform.
Two joint field missions with the WFP Logistics Cluster test the system where imagery is patchy and connectivity is poor. Exercises with the German Red Cross replay a past flood response using historical data, to check how the routing behaves when infrastructure fails.
Before a crisis, the system builds an enriched picture of the road network from freely available sources. Copernicus satellite imagery, weather and terrain data, OpenStreetMap, street-level photos from Mapillary and Panoramax, and open drone imagery from OpenAerialMap are combined to estimate attributes such as surface type, width, flood susceptibility, and how critical a given segment is as a bottleneck. This baseline runs continuously and gives planners a better starting point.
When a hazard occurs, the system screens for what is different. Hazard warnings, anomaly indicators derived from satellite data, sensor thresholds, and field reports are combined to flag areas of likely change across a wide region. These areas are then intersected with the corridors and bottlenecks, so attention goes to the places that affect delivery.
Only the highest-priority locations are escalated to detailed observation. Commercial radar satellites can see through cloud cover and at night, which matters during storms and floods when optical imagery is unusable. Ordering that imagery for priority areas keeps the approach affordable.
The observations are translated into travel costs on individual road segments in openrouteservice. The system raises the cost of using it in proportion to the confidence that it is degraded. A route returns an expected travel time together with a plausible range and the accumulated risk along the way. Every adjustment is logged with its source, so a planner can see that a segment was penalized because of a radar-derived flood mask, a surface class from street-level imagery, or a report from a colleague in the field.
The routing results reach users through interfaces built for logistics work rather than through a research prototype. This includes reachability areas showing what can be served within a given time, adaptive travel time ranges for convoy planning, and assessments of critical bottlenecks. The components are co-designed with the partner organizations and integrated into the systems they already use, including the WFP LogIE platform.
Two joint field missions with the WFP Logistics Cluster test the system where imagery is patchy and connectivity is poor. Exercises with the German Red Cross replay a past flood response using historical data to check how the routing behaves when infrastructure fails.
Replace the passable or blocked distinction with travel times that reflect partial damage, reduced speeds, and the chance that a route does not hold..

Direct limited observation capacity at the corridors that carry the response.

Show why a route was penalized and keep the planner in control, so that recommendations can be questioned.

Work both in international humanitarian operations, where base map data is thin, and in national civil protection, where the network is well mapped but vulnerabilities are not modeled.

Deliver the results through openrouteservice and the platforms partners already operate to ensure smooth integration into existing workflows.

HeiGIT coordinates the project and provides openrouteservice, the open-source routing engine at the center of the work. Its main technical contribution is the fusion of open satellite data, commercial satellite data, and other heterogeneous sources into a single picture of road conditions.
The Logistics Cluster, led by the World Food Programme, contributes operational requirements, field reference data, and access to the LogIE platform. It leads validation of adaptive convoy planning and the integration of the results into international humanitarian workflows.
The German Red Cross brings the national civil protection perspective, in particular the mobilization of the federal Medical Task Force. It contributes scenario expertise and leads validation for routing under damaged or disrupted infrastructure in Germany.
The project is funded through Federal Ministry of Research, Technology and Space. The DLR is the project coordinator. The funding program is called INSPECTEO (INtelligent Security for Public Entities and Critical Threats from Earth Observation) and is part of the “Space Innovation Hub” grant program.