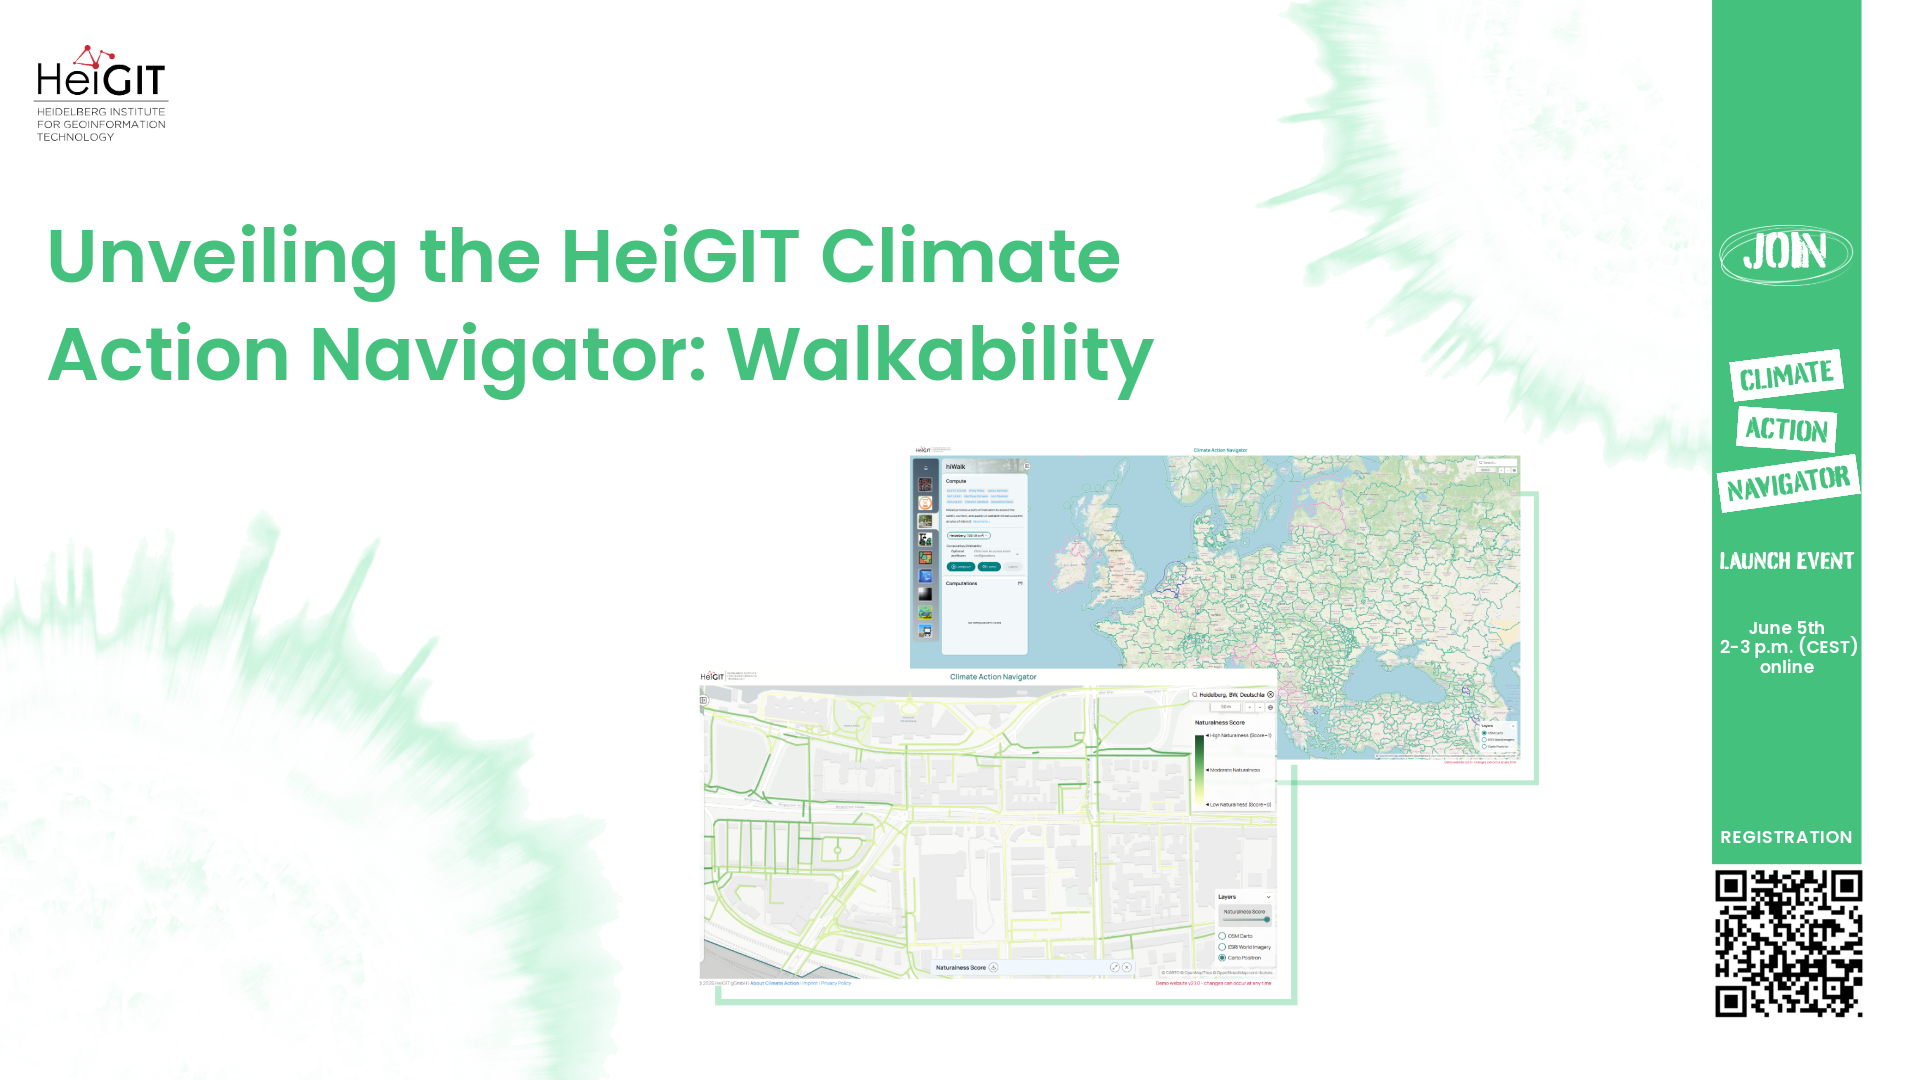
Unveiling the HeiGIT Climate Action Navigator Part 1 – Walkability
In just 22 days, on May 15th, we will officially launch the Climate Action Navigator (CAN): HeiGIT’s new dashboard offering high-resolution, open data-based insights into key climate action indicators. From assessing CO2 emissions from residential heating to urban active mobility infrastructure, CAN helps to identify where targeted action is most urgently needed.
In this first post of our blogpost series, we introduce hiWalk, one of CAN’s key assessment tools, which analyzes the walkability of cities and towns.
Why walkability matters for climate and quality of life
Cities worldwide must rethink mobility. The transport sector is not only a major contributor to urban CO₂ emissions, but also affects public health, equity, and quality of life. The transformation towards sustainable mobility represents an important lever to improve the lives of many. Walking and cycling — “active mobility” — offer efficient and low-impact urban transport solutions. They are already mirrored in the concept of 15-minute cities, stating that services to satisfy daily needs must be reachable within a short walk or bike ride.
However, many existing indices neglect the needs of marginalized communities and individuals with limited mobility. That is where the tools hiWalk and hiBike come in. They are co-created, open-source assessment tools for walkability and bikeability at the street level. Stakeholders such as Radlobby Austria, Lagos Urban Development Initiative (LUDI) and PLANUM Fallast & Partner work together with HeiGIT to ensure inclusive, practical, and street-level assessments.
What does hiWalk measure?
hiWalk assesses the quality and accessibility of walking infrastructure, e. g., whether sidewalks exist, or how pleasant they actually are for pedestrians. hiWalk is work in progress, so the number of its assessment tools will grow with time. In its current state, hiWalk assesses five key dimensions to evaluate how walkable a street or area is.
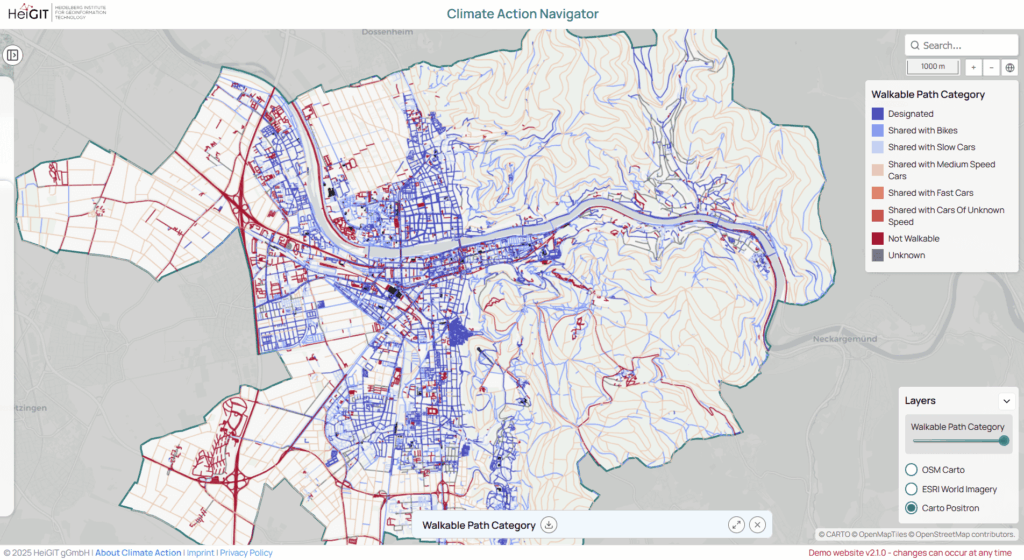
- Walkable Path Categories: Who shares this path with me?
This indicator classifies pedestrian infrastructure based on whether pedestrians share space with cyclists or motor vehicles. Paths exclusively for pedestrians are safer and more comfortable to walk on, while streets shared with fast-moving motorized traffic are considered less safe or comfortable. The assessment is based on OpenStreetMap (OSM) tags.
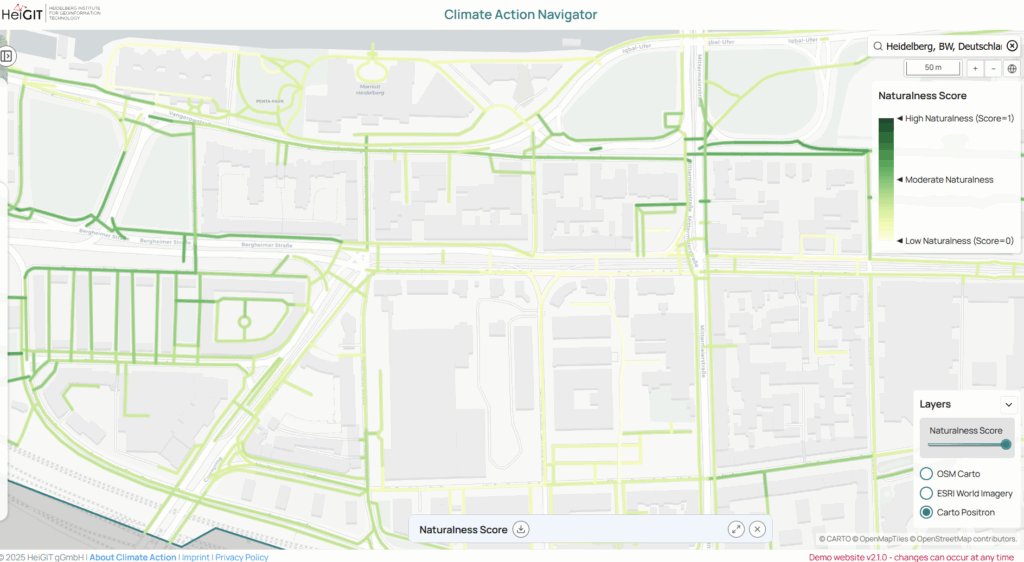
- Naturalness: How green and pleasant is this street?
High vegetation coverage and the presence of water bodies not only make walking more attractive but also provide cooling and increase well-being. Using Sentinel-2 satellite imagery, Naturalness assesses the presence of vegetation by calculating the Normalized Difference Vegetation Index (NDVI) within 15m of each path. For analyzing blueness, Naturalness calculates water coverage based on the Sentinel Scene Classification Map (SCL). The radius of 15 m is chosen to reflect the environment as perceived by pedestrians. Users can choose to view either overall naturalness, greenness, or blueness independently.
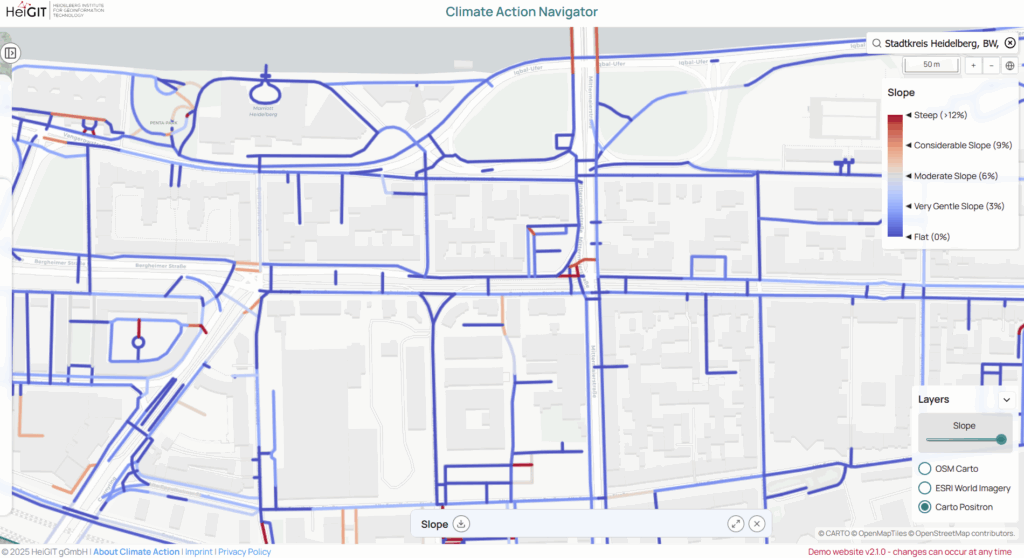
- Slope: How steep is this path?
Even a well connected, green pedestrian infrastructure can be challenging to walk if paths are too steep. Therefore, Slope estimates path steepness using elevation data from the Shuttle Radar Topography Mission (SRTM). Its spatial resolution of 90×90 m is rather coarse for sub-city analyses. As a result, slopes may be generally underestimated in relatively flat areas. Conversely, slope can be sharply overestimated for short road segments that begin and end in different grid cells.
Slope classifies paths based on thresholds from Alves et al. (2020):
- 0 to 5 %: “Suitable” for most, including older adults and wheelchair users
- 5% to 8 %: “Acceptable”, but more strenuous
- More than 8 %: “Inappropriate” for many and potentially unsafe
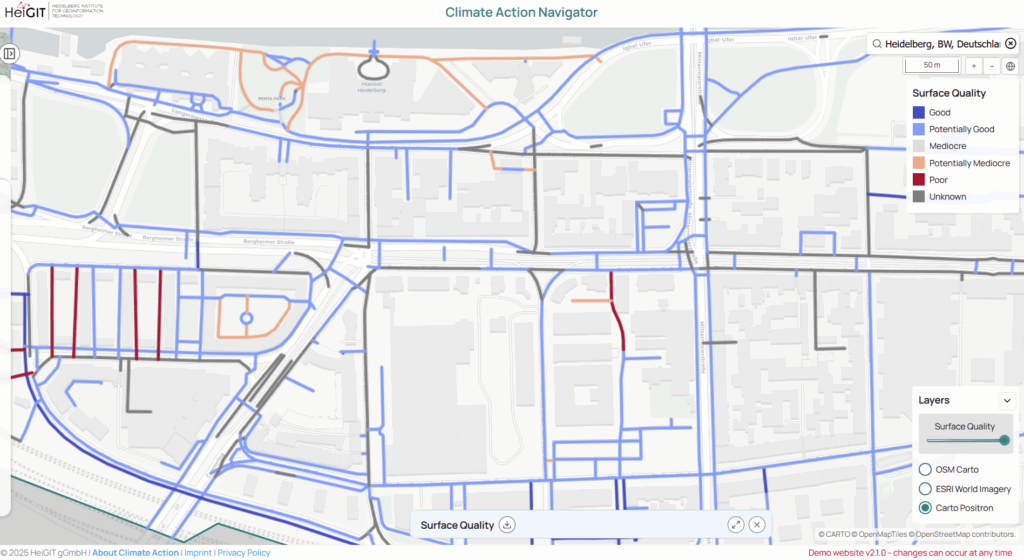
- Surface Quality: Can I walk here comfortably — especially with a wheelchair or pram?
The Surface Quality indicator uses OpenStreetMap (OSM) tags to assess path smoothness. The assessment tool prioritizes the needs of people with limited mobility, considering the requirements of wheelchairs and wheeled walking frames. Within OSM, tags are used to describe specific features of map elements. Each map element (e.g., a foot path) is assigned tags that define its characteristics. Where available, hiWalk uses the tag smoothness, which describes how smooth and even the surface is. Where smoothness information is not available, hiWalk infers smoothness information by using the tags surface (referring to the material of the path’s surface, such as asphalt or gravel), and tracktype (related to the firmness and maintenance state of a path’s surface). Paths with known rough materials (like cobblestones) are rated “mediocre,” while surfaces like asphalt are rated “potentially good”.
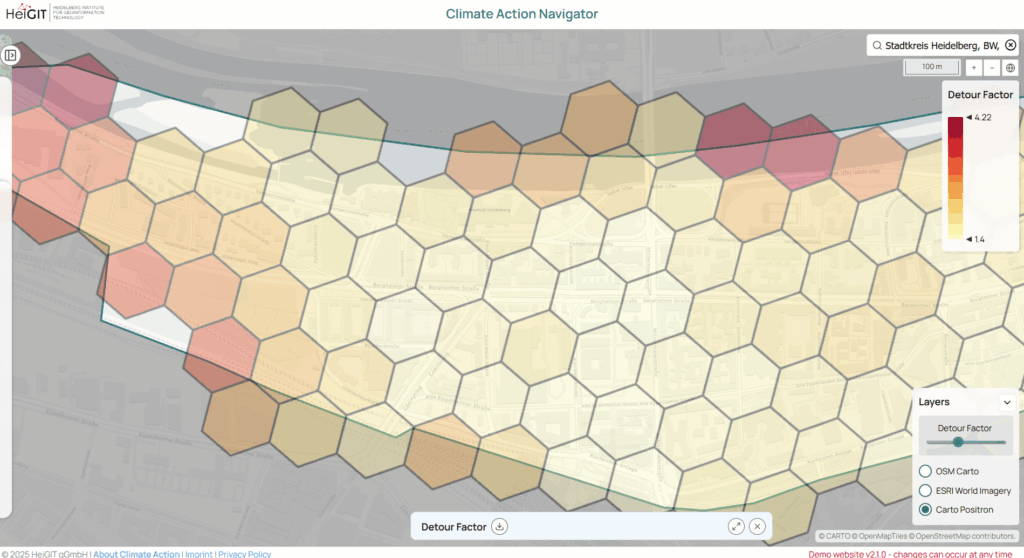
- Detour Factor: Can I get where I need to go — directly?
The Detour Factor measures network connectivity by comparing walking distances along paths with straight-line distances (i.e., “as the crow flies”). A Detour Factor of 1 means optimal connectivity, whilst higher values indicate more indirect routes and low network connectivity. The Detour Factor is the average ratio between the actual walking distance and the distance in a straight line from the center of each cell to its adjacent cells.
Well-connected pedestrian networks decrease travel time and thus make walking a more attractive alternative to driving. This is a crucial factor in promoting sustainable mobility.
CAN and hiWalk: tools for action
CAN, and more specifically hiWalk, are more than just tools to assess climate mitigation measures in cities worldwide. They aim to identify local strengths, highlight areas for improvement, and support the development of targeted solutions to make cities livable, inclusive, and climate-resilient. Unlike traditional indices, CAN’s assessment tools are co-created with urban planners, advocacy groups, and local stakeholders to ensure practical and actionable results.
What’s next?
CAN and its assessment tools like hiWalk are living tools, i. e. they continue to evolve through feedback and co-creation with partners worldwide, and more assessment tools will soon be added to the pool. On May 15th, the Climate Action Navigator will launch publicly. From then on, users can assess their city or other areas of interest with respect to walkability, bikeability, and heating emissions (the latter currently only in Germany). We warmly invite you to our online launch event on June 5th, 2pm (CEST) to get valuable insights on the development and use of our Climate Action Navigator.
Stay tuned for next blogpost of this series to get to know more indicators. Get in touch with us (kirsten.vonelverfeldt@heigit.org) if you have any questions or input and follow this website for new updates.