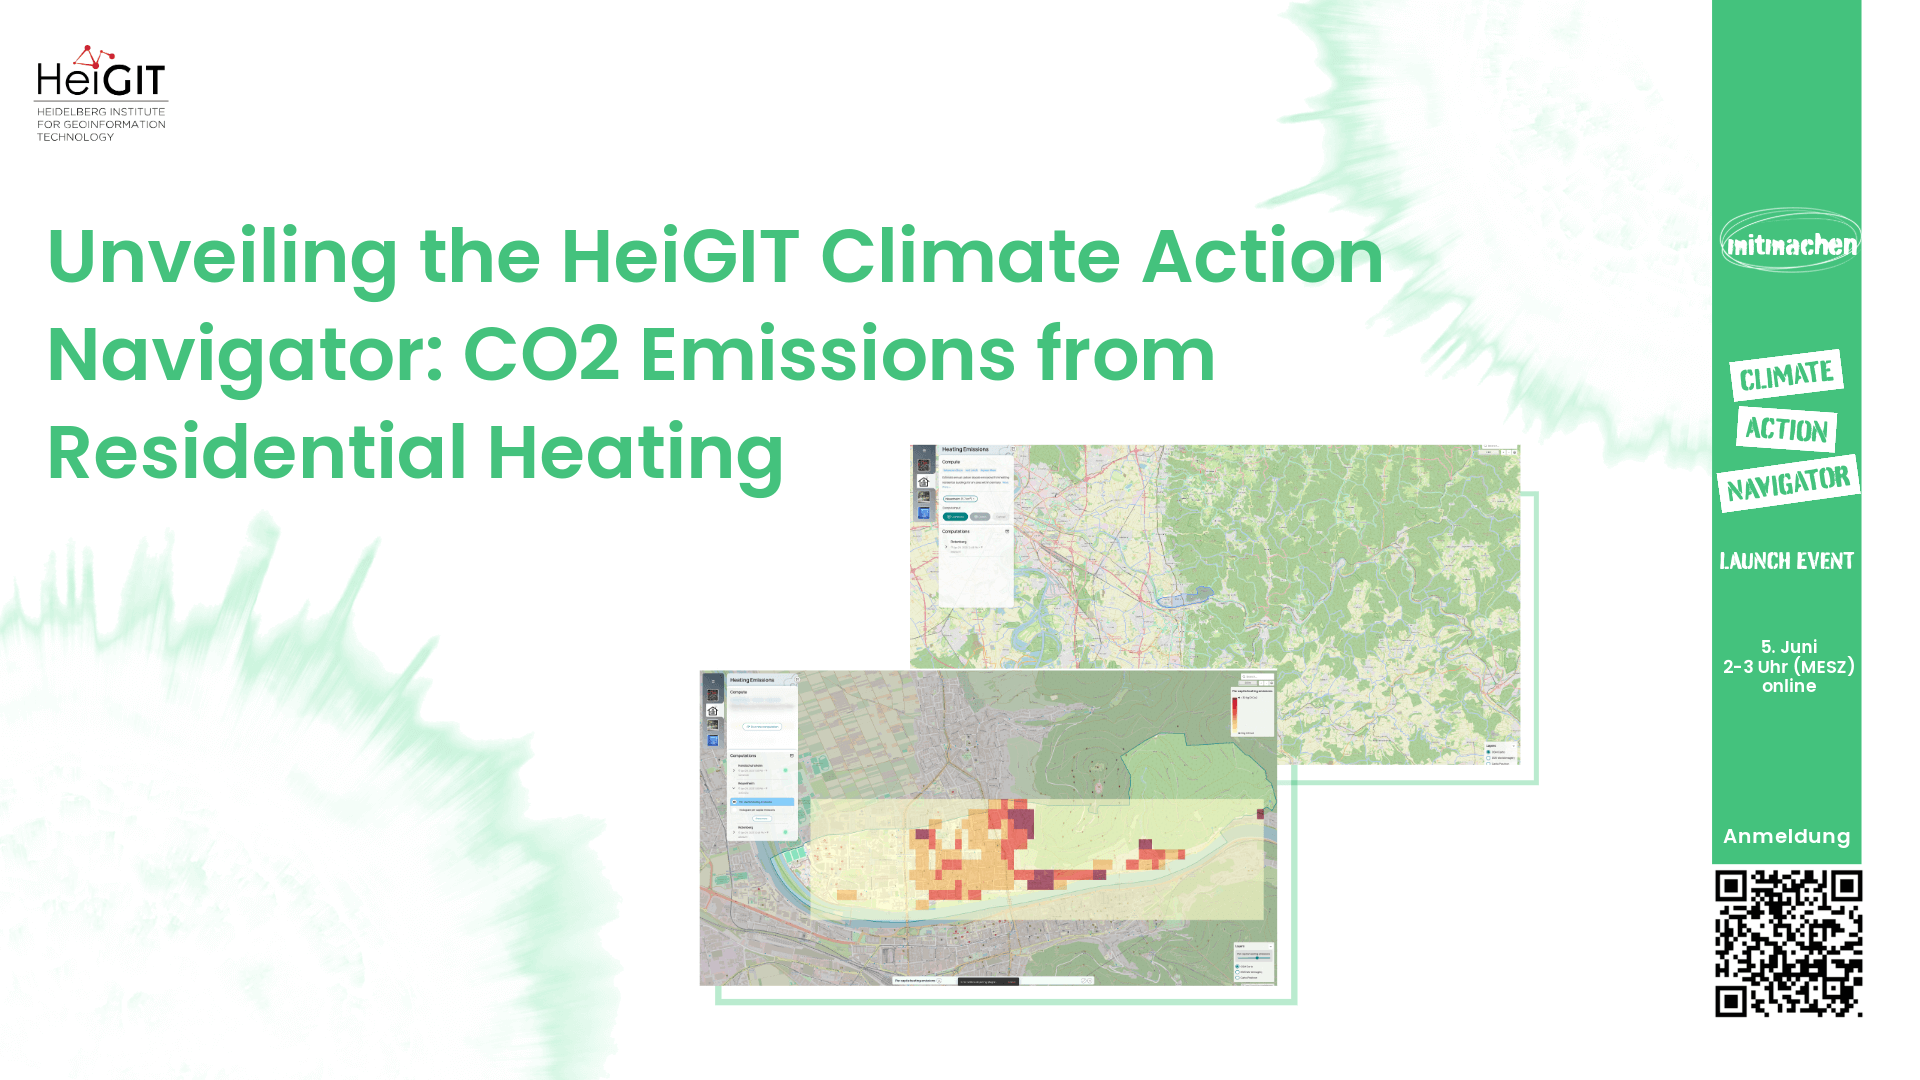
In just 8 days, on May 15th, we will officially launch the Climate Action Navigator (CAN), HeiGIT’s interactive dashboard offering high-resolution data and analysis on key climate indicators, from the quality and availability of mobility infrastructure to carbon dioxide emissions from heating of residential buildings.
In this third part of our blog post series, we present the Heating Emissions assessment tool, which helps city administrations, NGOs and other interested parties identify where CO2 emissions from residential heating are highest, and thus where interventions could be most impactful.
Heating: A major, often unheeded source of emissions
Reducing CO2 emissions is an urgent priority to mitigate the climate crisis. Since CO2 is emitted across nearly every aspect of daily life, effective climate action requires a better understanding of where, when and why emissions occur. In Germany, as in many other countries with temperate climates, keeping our homes warm is a major source of CO2 emissions. For instance, around three quarters of all households in Germany still rely on burning fossil fuels like natural gas and oil to stay warm, making residential heating a key sector to mitigate climate change.
To better understand the problem and tackle it effectively, we need accurate emissions data at the finest resolution possible, not only at the level of whole cities and countries. That is where the Heating Emissions assessment tool comes in.
How does the Heating Emissions assessment work? From census to carbon
The Heating Emissions assessment tool uses a bottom-up approach to estimate CO₂ emissions from heating in residential buildings. “Bottom-up” means that we first estimate how much energy is used for heating residential buildings and multiply this value by a number representing the average grams of CO2 emitted per unit of energy (i.e., an “emission factor”). The estimates are largely based on 100-m gridded data from the 2022 German census, which we can use to infer location-specific energy consumption and emission factors across Germany.
First, for each 100-m grid cell in the area of interest, we multiply population density by the average living space per capita to obtain the total residential space in the grid cell, which is the area that people potentially heat. Note that this assumes that all the available living space is heated. People can save lots of energy (and avoid emissions) by heating only the spaces most frequently used (i.e., the living room).
Next, we use building age data from the census to estimate building’s energy consumption rates. Older buildings, especially those constructed in the post-war period (1945 to 1970) tend to be poorly insulated and, if they have not been renovated, to consume more heating energy per unit area. We combined census data with age-specific energy consumption data from co2online to estimate the average consumption rate for each grid cell.
Finally, the 2022 census also reports the number of buildings with different heating energy sources for each grid cell. These energy sources (or, to be more technically precise, “energy carriers”) include gas, oil, coal, wood, heat pumps, and district heating, among others. Producing one unit of heat with each of these energy sources results in different amounts of CO2 emissions. By accounting for the number of buildings using different energy carriers in each grid cell, we can compute an average emission factor for that location. Burning wood or coal typically results in the highest emissions (burning wood, while terrible for air quality, has a nearly neutral climate impact, as the released carbon was “recently” captured by a tree). In contrast, using heat pumps or district heating results in no emissions. Of course, carbon is still emitted at district heating and power plants, but not directly from the residential buildings themselves. This highlights an important aspect of the current heating emission estimates: they include only emissions originating directly from residential buildings (aka, scope 1 emissions). Later versions of the assessment tool will also estimate emissions associated with buildings´ electricity and district heating consumption (aka, scope 2 emissions).
By multiplying the location-specific emission factor and energy consumption rate by the total heated space, we can estimate CO₂ emissions associated with heating residential buildings.
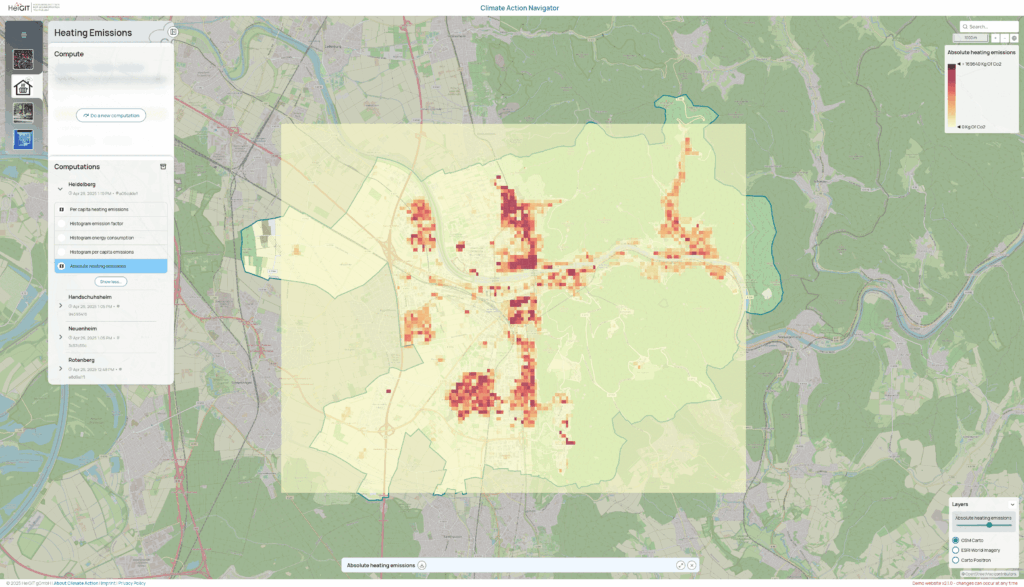
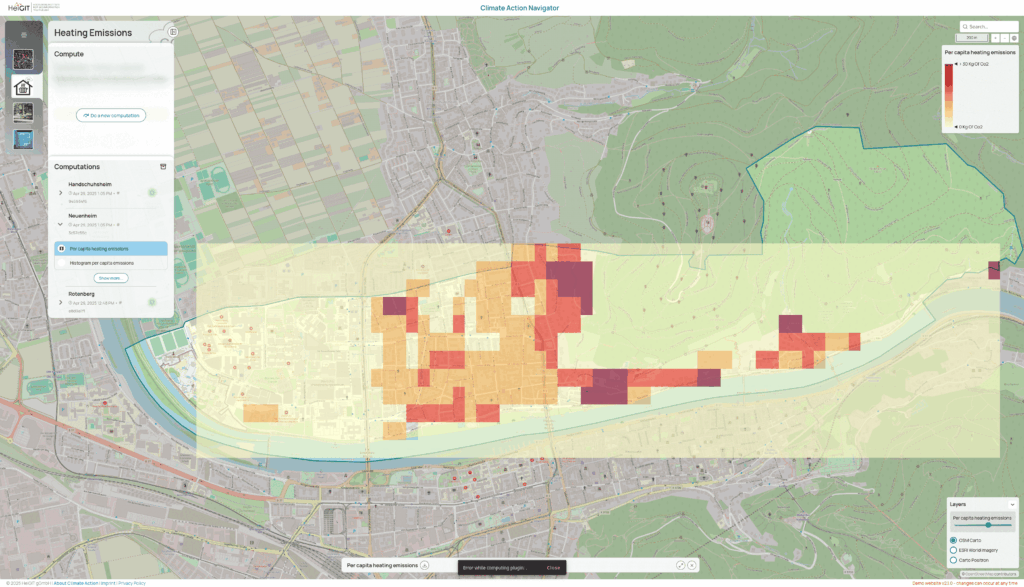
Case study: Heidelberg
In Heidelberg, Germany, for example, 57.1 % of residential buildings are heated with natural gas, 12.1 % use oil, and a small share of 0.3 % still uses coal (26.1 % rely on district heating, while less than 2 % have heat pumps). This fuel mix leads to considerable heating-related CO2 emissions, particularly in older, less efficient buildings.
But what if households switched to renewable systems like heat pumps? Imagine a scenario, for example, if all households in Heidelberg currently heated with oil or coal switched to heat pumps. The city’s residential heating emissions would drop by nearly 18 % (please note that this estimate only includes CO2 emitted directly from residential buildings. Emissions from electricity generation to power heat pumps are not yet included).
Why localised emissions data matters
While national inventories are indeed useful, local climate action requires data at much higher spatial and temporal resolution. By focusing on the sub-city level, the Heating Emissions assessment tool can help stakeholders to identify emission hotspots, prioritise neighbourhoods needing building retrofits or heating upgrades, assess the success of policy changes, and monitor progress over time.
What is next?
This is only the first, demo version of our Heating Emissions assessment tool. We are already working on new features, such as incorporating building-level data to further refine our estimates and use weather data to move from annual to hourly estimates. Eventually, we plan to expand the assessment tool to use international datasets for broader usage and comparability.
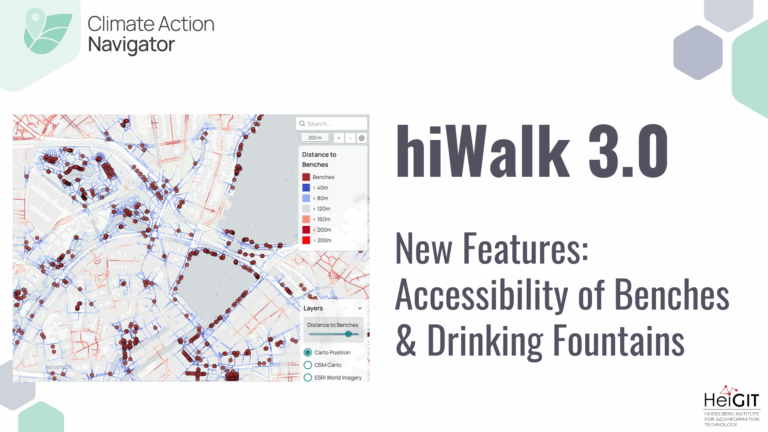
The Heating emissions assessment tool is just one part of the Climate Action Navigator, which also includes hiWalk and hiBike, and which constantly evolves to host more tools, assessing e.g. land consumption, CO2 budgets, public transport, or traffic emissions.
From insight to action: The Climate Action Navigator
The Climate Action Navigator and its tools are more than just tools to assess climate mitigation measures in cities worldwide. They aim to identify local strengths, highlight areas for improvement, and support the development of targeted solutions to make cities livable, inclusive, and climate-resilient. Unlike traditional indices, CAN’s assessment tools are co-created with urban planners, advocacy groups, and local stakeholders to ensure practical and actionable results.
What’s next?
The Climate Action Navigator and its assessment tools like Heating Emissions are living tools, i. e. they continue to evolve through feedback and co-creation with partners worldwide, and more assessment tools will soon be added to the pool. On May 15th, the Climate Action Navigator will launch publicly. From then on, users can assess their city or other areas of interest with respect to walkability, bikeability, and heating emissions (the latter currently only in Germany). We warmly invite you to our online launch event on June 5th, 2pm (CEST) to get valuable insights on the development and use of our Climate Action Navigator.
Stay tuned for next blogpost of this series – and in case you missed it, read our blogposts about hiWalk and hiBike.
Do you have questions or feedback? Reach out to kirsten.vonelverfeldt@heigit.org.