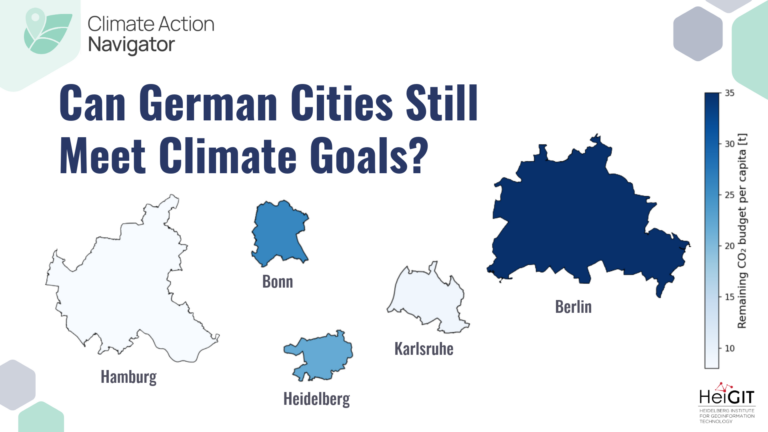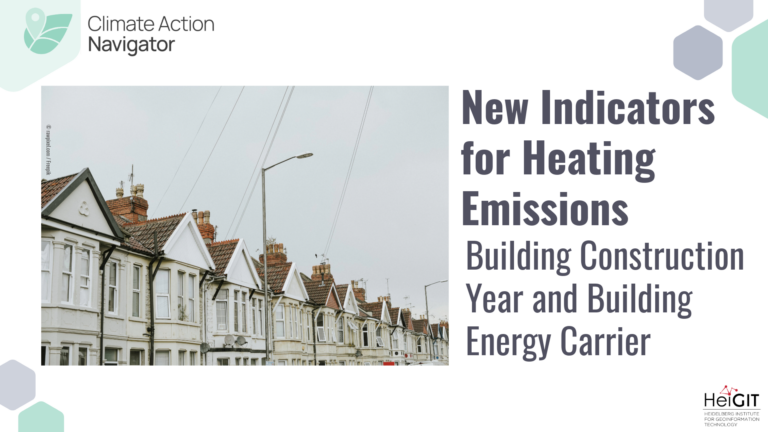
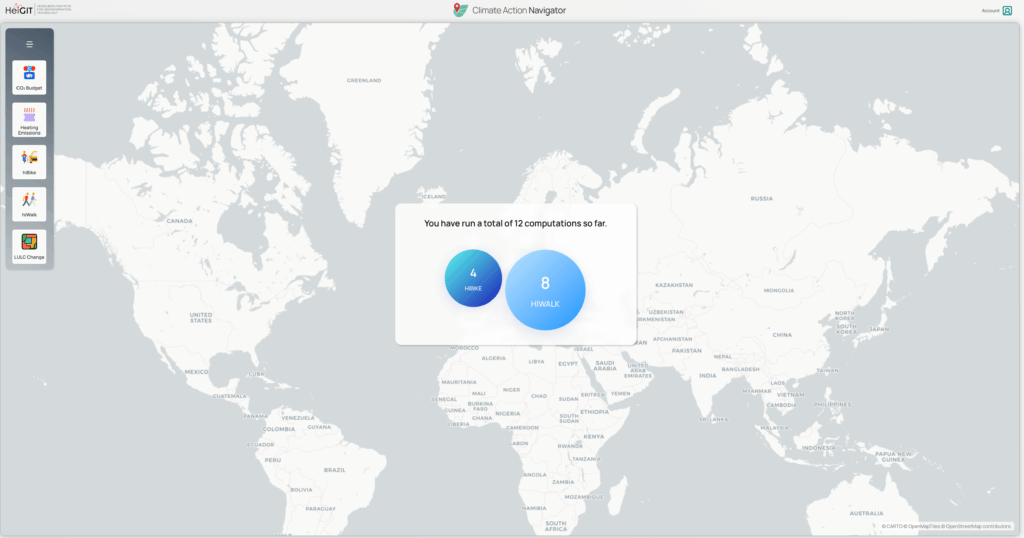
In May this year we officially launched the Climate Action Navigator (CAN): HeiGIT’s new dashboard offering high-resolution, open data-based insights into key climate action indicators. From assessing CO2 emissions from residential heating to urban active mobility infrastructure, CAN helps identify where targeted action is most urgently needed.
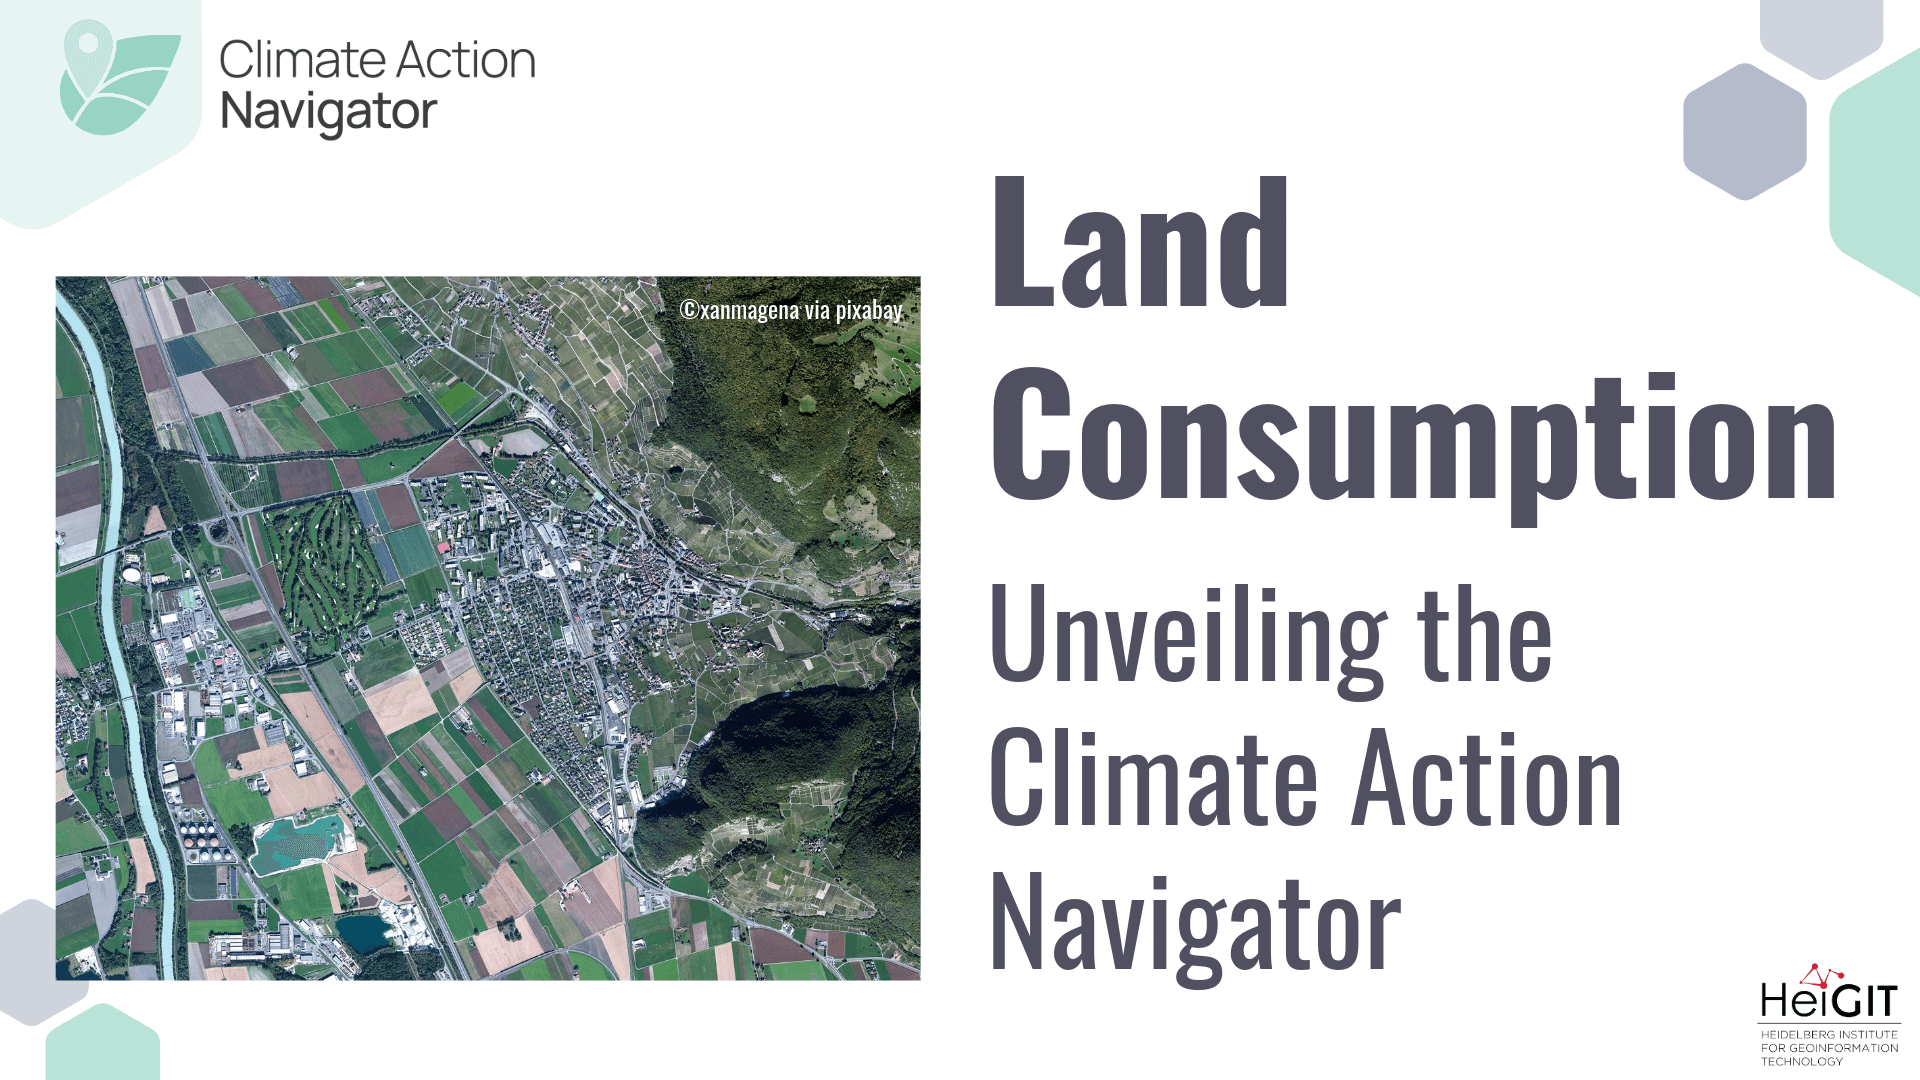
In this fifth post of our blogpost series, we introduce Land Consumption, one of CAN’s key assessment tools. Land consumption is defined as the conversion of non-urban land, such as agricultural areas, forests, or natural landscapes, into built-up or sealed surfaces through settlement expansion, infrastructure development, or industrial use. Typically, it results in soil sealing and a loss of ecosystem functions.
Why land consumption matters for climate and quality of life
Accurate and high-resolution data matter for progress towards sustainable development. In particular, urban regions are witnessing a rapid increase in land consumption, which leads to multiple environmental and socio-economic challenges. The expansion of built-up areas is closely linked to biodiversity loss, increased greenhouse gas emissions, and the acceleration of land degradation processes. At the same time, urban land consumption has profound implications for social and spatial planning, including the loss of historical and cultural landscapes as well as the reduction in availability and quality of green spaces. This not only affects the quality of life in cities but also their capacity to adapt to future challenges.
For example in Germany, land consumption is increasing. According to the German Federal Statistical Office (Destatis), 45 hectares per day are being consumed for new roads and buildings (Siedlungs- und Verkehrsfläche) in 2019. By 2023, this figure had increased to 53 hectares per day. In its national sustainability strategy, the German government aims to reduce the average daily increase to under 30 hectares by 2030. By 2050, the goal is to achieve net-zero new settlement and transport areas. Despite this statistics, the geographical distribution of this consumption remains uncertain.
The Climate Action Navigator enables an assessment of land consumption by offering high-resolution worldwide data that surpasses the resolution of conventional land-use monitoring tools. The development of this assessment tool was a collaborative effort with WWF Austria, who advised on the content and direction of the tool. Our goal is to provide accurate data to support decision-making processes towards a sustainable land use while also ensuring international comparability. This is valuable for urban planning, policymakers and decision-makers to raise awareness for future decisions.
Note for users: Land Consumption currently supports only small- to medium-sized cities. Larger cities (e.g., Paris, Berlin, Vienna) will be supported in future releases. In the meantime, Land Consumption still runs on districts and neighborhoods, allowing you to select portions of those cities even if you can’t run it on the entire city at once.
What does Land Consumption measure?
The purpose of Land Consumption is to estimate the proportion and type of land consumption in a given area. It assesses how much land is taken up by buildings, parking lots, streets, and other built-up areas, both in aggregate and proportionally among land use classes such as commercial, residential, and industrial. To do this, Land Consumption distinguishes between two categories:
- Consumed land: developed land including buildings, roads, parking areas, and other built infrastructure, excluding agricultural, natural, or semi-natural areas.
- Settled land: all human-altered or developed land, such as agriculture, buildings, and paved areas, but excludes natural land.
Land use object and class identification with OSM
To analyze land consumption, the plugin draws on OpenStreetMap data to identify how land is used and consumed in a given area. It identifies different features such as buildings, parking lots, roads, built-up, agricultural land, and natural land using OSM tags. In addition, the plugin also considers different land use classes such as residential, commercial, infrastructural, and institutional areas, agricultural, and natural land use to estimate how much land is consumed by different types of human activity.
Tabels and Treemap to visualize land consumption
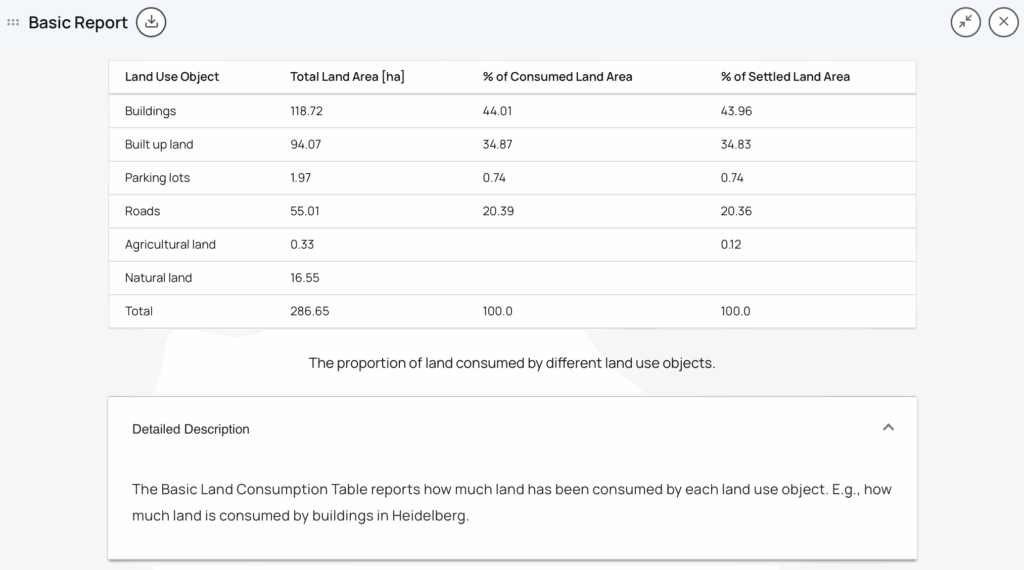
These findings are then reported as two tables (basic table and detailed table) and a treemap. All three include the following output variables: Total Land Area [ha] (Buildings occupy 118.72 ha in Innere Stadt, Vienna), % of Consumed Land Area (Buildings account for 44.01% of consumed land in Innere Stadt, Vienna) and % of Settled Land Area (Buildings account for 43.96% of settled land in Innere Stadt, Vienna).
For the basic table, the Land Consumption plugin reports the total land area and the proportion of total land area for each land use object (e.g., buildings, roads, parking lots) as well as the proportion each object contributes to “consumed land” and “settled land” in the given area.
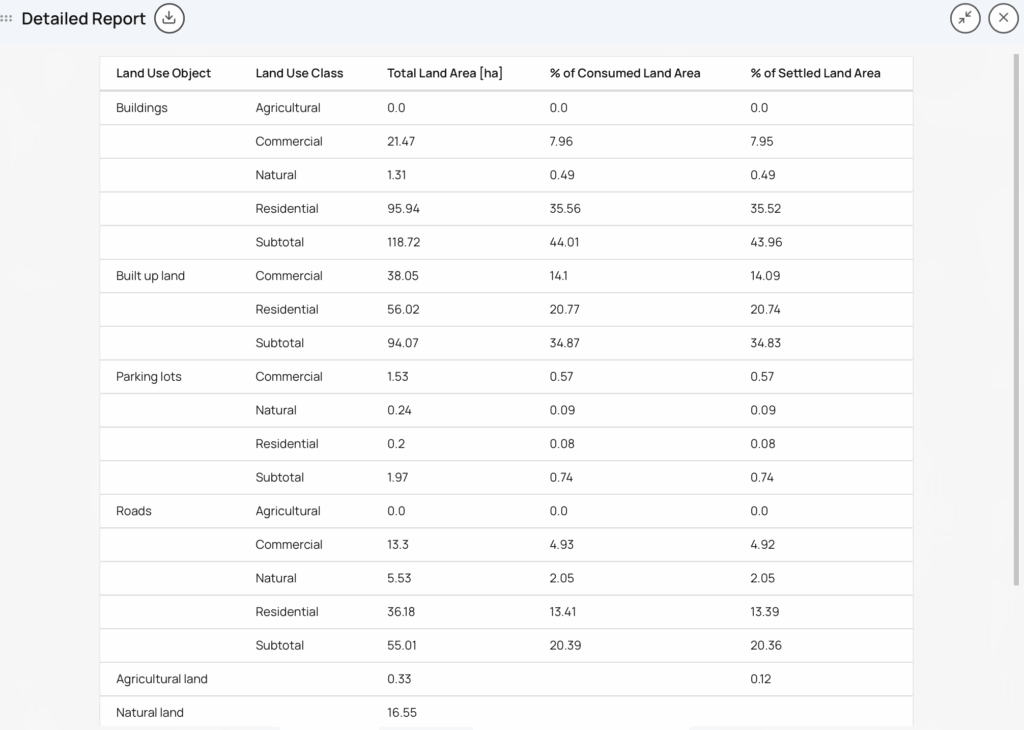
The detailed table goes one step further and calculates how much land is consumed and used for each land use object and land use class (e.g., commercial, residential, industrial).
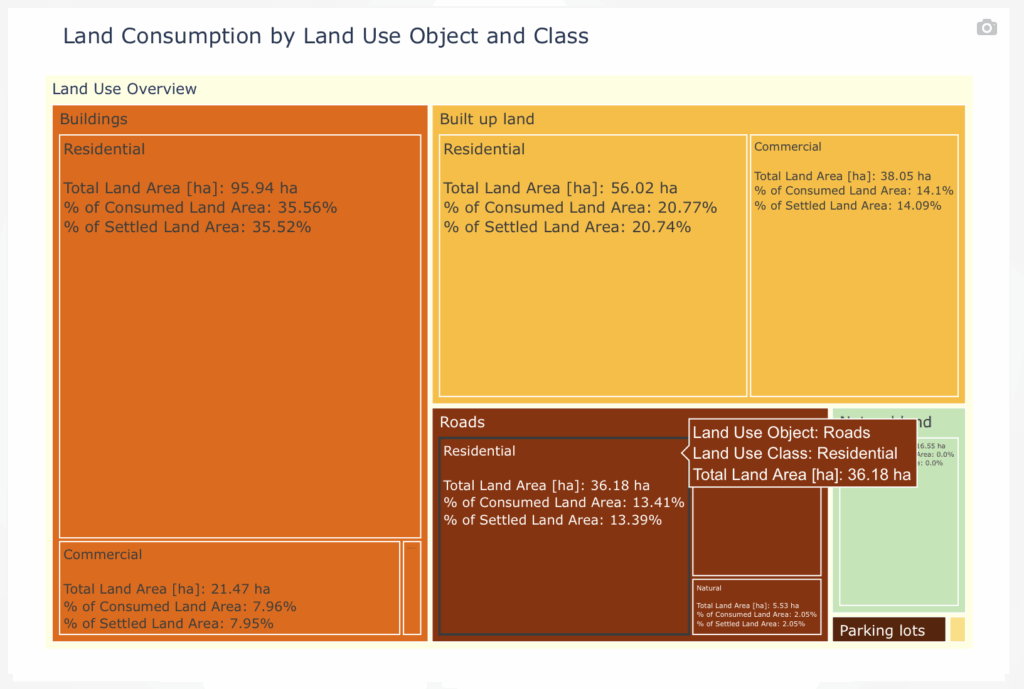
Finally, the treemap reports the same information as the detailed table but as a hierarchical visual to show which land use objects and classes consume the most land in a given area.
From insight to action: the Climate Action Navigator
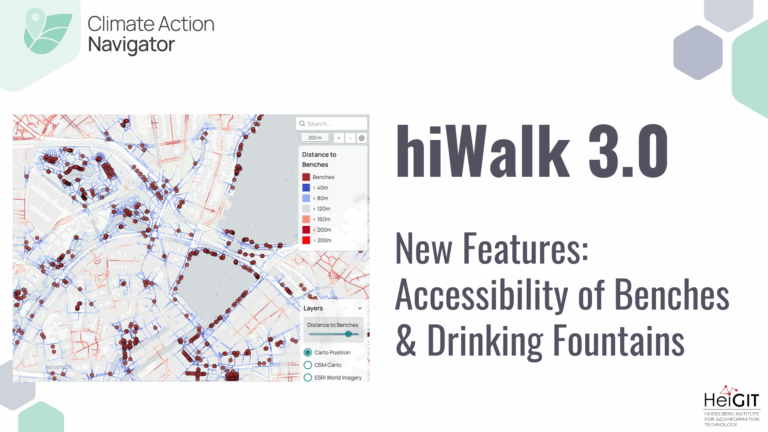
The Climate Action Navigator offers several climate action tools such as hiBike, Land Consumption, hiWalk, Heating Emissions, and more to come soon. These are designed to help stakeholders such as NGOs, city administrations, citizens’ initiatives to identify strengths as well as gaps of climate mitigation in different areas. As CAN’s assessment tools visualize data at street-level resolution, interventions and improvements can be targeted and consider the specific local context. Unlike many traditional indices, CANs indicators are co-created with urban planners, advocacy groups, and local stakeholders to ensure relevant, practical, and actionable results. Whenever possible, CAN’s assessment tools use freely accessible data (like OpenStreetMap and satellite imagery) and open software tools, thereby ensuring accessibility, broad applicability, and adaption opportunities.
What’s next?
Land Consumption and CAN in general are work in progress. The assessment tools will be constantly improved and developed further to meet the needs of our partner organizations. On June 5th, the world environment day, we held a launch event, the video of which you can see here.
In case you missed it, read our posts on hiWalk, hiBike, Heating Emissions and Land Use and Land Cover Change. More information and a FAQ on the Climate Action Navigator and its assessment tools can be also found on the project webpage.
Do you have questions or feedback? Reach out to climate-action-navigator@heigit.org.