Estimating and reducing emissions from road transport has been a longstanding focus of research and policy. A persistent challenge is the spatial visualization of these emissions, specifically the modeling of emissions along routes and the factors influencing their distribution.
At FOSSGIS 2026, Leonie Größchen shared BKG’s work on calculating and showing emissions along routes. By combining routing with environmental data from the Umweltbundesamt, their method supports a better understanding of transport emissions and lays the groundwork for adding emission data to routing systems in the future.
Project Description and the Role of openrouteservice
The Federal Agency for Cartography and Geodesy runs a routing service for federal use that is based on openrouteservice. This service is expanded with a web interface that uses the Masterportal routing module.
Within this setup, the presenter explained a method developed at BKG to calculate emissions along routes. The approach combines OpenStreetMap (OSM) road data with emission factors from the “Handbuch für Emissionsfaktoren des Straßenverkehrs” (HBEFA) from the Umweltbundesamt.
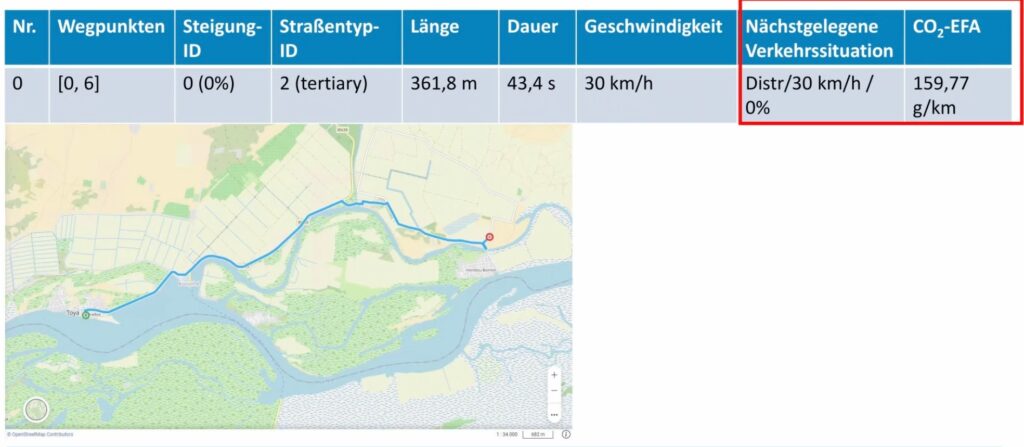
Routes are created and split into segments using openrouteservice. For each segment, three main factors are considered road type, slope, and speed. These factors are analyzed and matched to the closest traffic situation in the HBEFA dataset. This makes it possible to estimate emissions like CO₂ for each segment in detail.
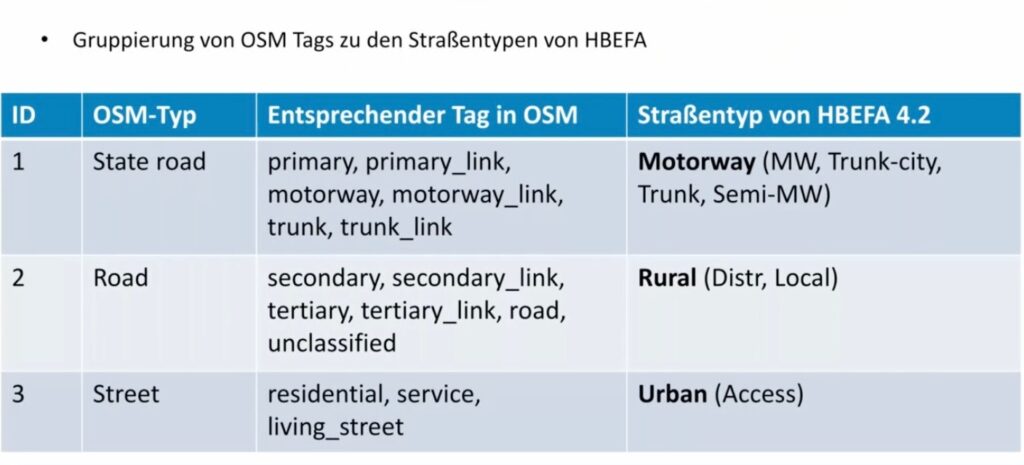
One main challenge is connecting the detailed road information from OSM to the broader HBEFA categories, like motorways, rural roads, and urban roads. This is addressed by grouping OSM tags into matching classes, which helps combine the datasets effectively.
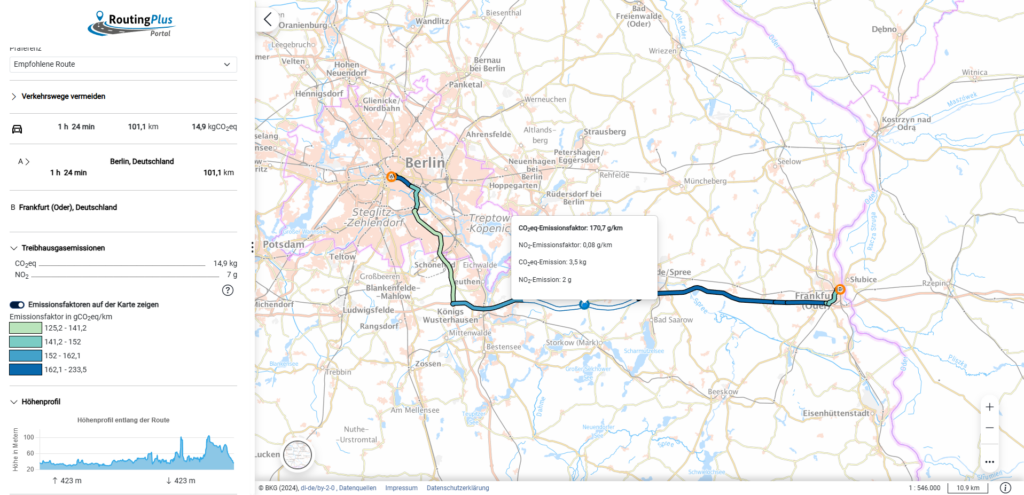
The results are shown in the RoutingPlus portal, where the previously calculated route segments get color-coded by emission levels. This lets users quickly spot sections with higher emissions. Along with totals like CO₂ and NO₂, detailed data is given for each segment. It is planned to add this feature to the MasterPortal core.
By combining openrouteservice with OpenStreetMap data and emission models from the Umweltbundesamt, emissions can be calculated and shown in detail. This enables finding route segments with high emissions and lays the groundwork for emission-transparent mobility decisions.
The project also demonstrates the importance of bringing together diverse data sources when combining geospatial and environmental information. Over time, these methods can help develop routing solutions that account for environmental impact.
More on Traffic Emissions
More research and development on transport emissions have been carried out also from a complementary perspective at HeiGIT: the Traffic Emissions assessment tool on the Climate Action Navigator estimates road transport-related CO₂ emissions at street and district level. Instead of calculating emission values along a specific route, it visualizes total emissions for a given area, identifying which places are most impacted by traffic emissions.