![Figure 1. Total carbon fluxes related to LULCC in Baden-Württemberg between March 2018 and October 2019 (LaVerDi, OSMlanduse+), and March 2018 and March 2020 (OSMlanduse, OSMlanduse cleaned). The upper plot shows the relative difference of carbon fluxes [%] with respect to LULC transition and carbon flux attribution method. The carbon fluxes of method 1 are set to 0. The lower plot shows the total absolute carbon fluxes [Mg C] calculated with carbon flux attribution method 1 with respect to LULC transition and LULCC method.](https://heigit.org/wp-content/uploads/2023/05/ed501d68-7952-4263-a23e-a5f8a81fa7a4.png)
Featured Image: Figure 1. Total carbon fluxes related to LULCC in Baden-Württemberg between March 2018 and October 2019 (LaVerDi, OSMlanduse+), and March 2018 and March 2020 (OSMlanduse, OSMlanduse cleaned). The upper plot shows the relative difference of carbon fluxes [%] with respect to LULC transition and carbon flux attribution method. The carbon fluxes of method 1 are set to 0. The lower plot shows the total absolute carbon fluxes [Mg C] calculated with carbon flux attribution method 1 with respect to LULC transition and LULCC method.
Spatially explicit information on carbon fluxes related to land use and land cover change (LULCC) is useful for local climate change mitigation strategies. However, estimates of these carbon fluxes are often aggregated to larger areas. Because it provides spatial information at a high level of detail, OpenStreetMap (OSM) can be used to derive spatially explicit LULCC. In their paper, Ulrich et al. assess the potential of OSM to quantify LULCC-related carbon fluxes to the atmosphere for a regional case study, the German federal state of Baden-Württemberg.
Methods
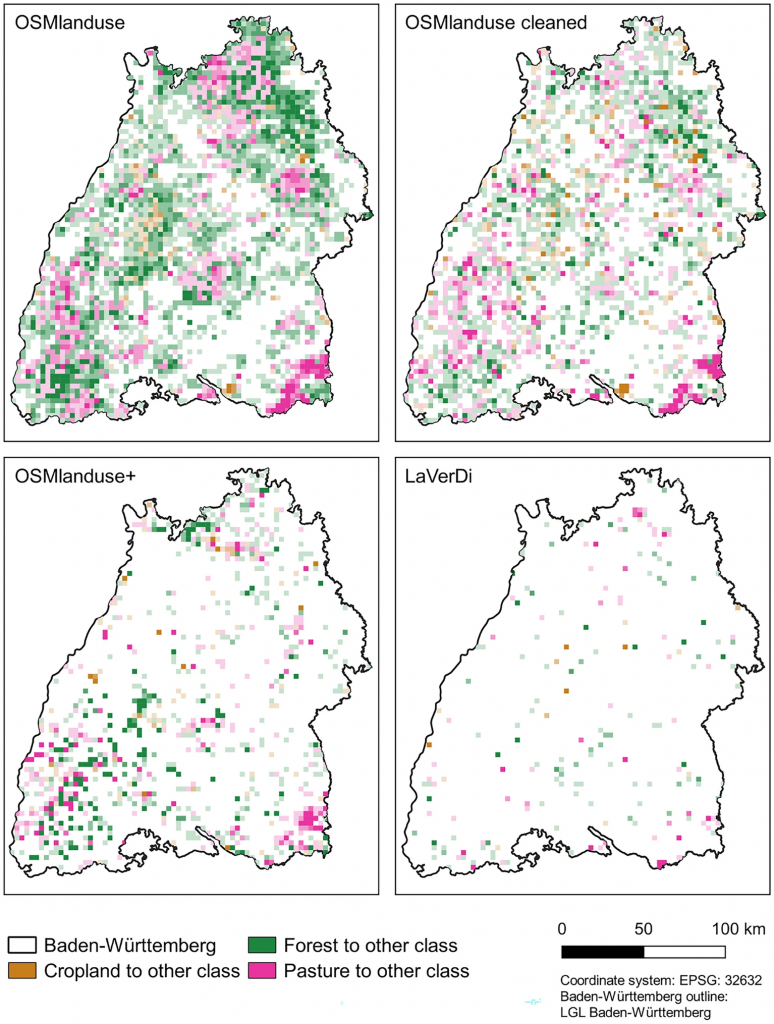
We estimated carbon fluxes related to LULCC in Baden-Württemberg using different emission factors. In doing so, we compared four different data sources regarding their suitability for this task: (a) a land cover dataset derived from OSM (OSMlanduse); (b) OSMlanduse with removal of sliver polygons (OSMlanduse cleaned), (c) OSMlanduse enhanced with a remote sensing time series analysis (OSMlanduse+); (d) the LULCC product of Landschaftsveränderungsdienst (LaVerDi) from the German Federal Agency of Cartography and Geodesy.
Results
There were large differences in the extent of the LULCC detected with the different change methods, leading to a high range of carbon flux estimates. Except for the OSMlanduse change method, all LULCC methods achieved results that are comparable to other studies. The carbon flux estimates of the most plausible change methods, OSMlanduse cleaned and OSMlanduse+, were 291,710 Mg C yr-1 and 93,591 Mg C yr-1, respectively. Factors causing uncertainties included incomplete spatial coverage of OSMlanduse, false positive LULCC due to changes and corrections made in OSM during the study period, and a high number of sliver polygons in the OSMlanduse changes.
Conclusion
If data preprocessing, especially the removal of sliver polygons, is performed with the suggested methods, OSM can be successfully used to estimate LULCC carbon fluxes. The approach of this study can be applied to calculate the carbon fluxes related to LULCC for a given area or any specific LULCC. By providing explicit spatial estimates of carbon fluxes related to LULCC, it can help to increase the knowledge about local drivers of climate change, which is a prerequisite for measures to reduce LULCC emissions and mitigation strategies on the local scale.