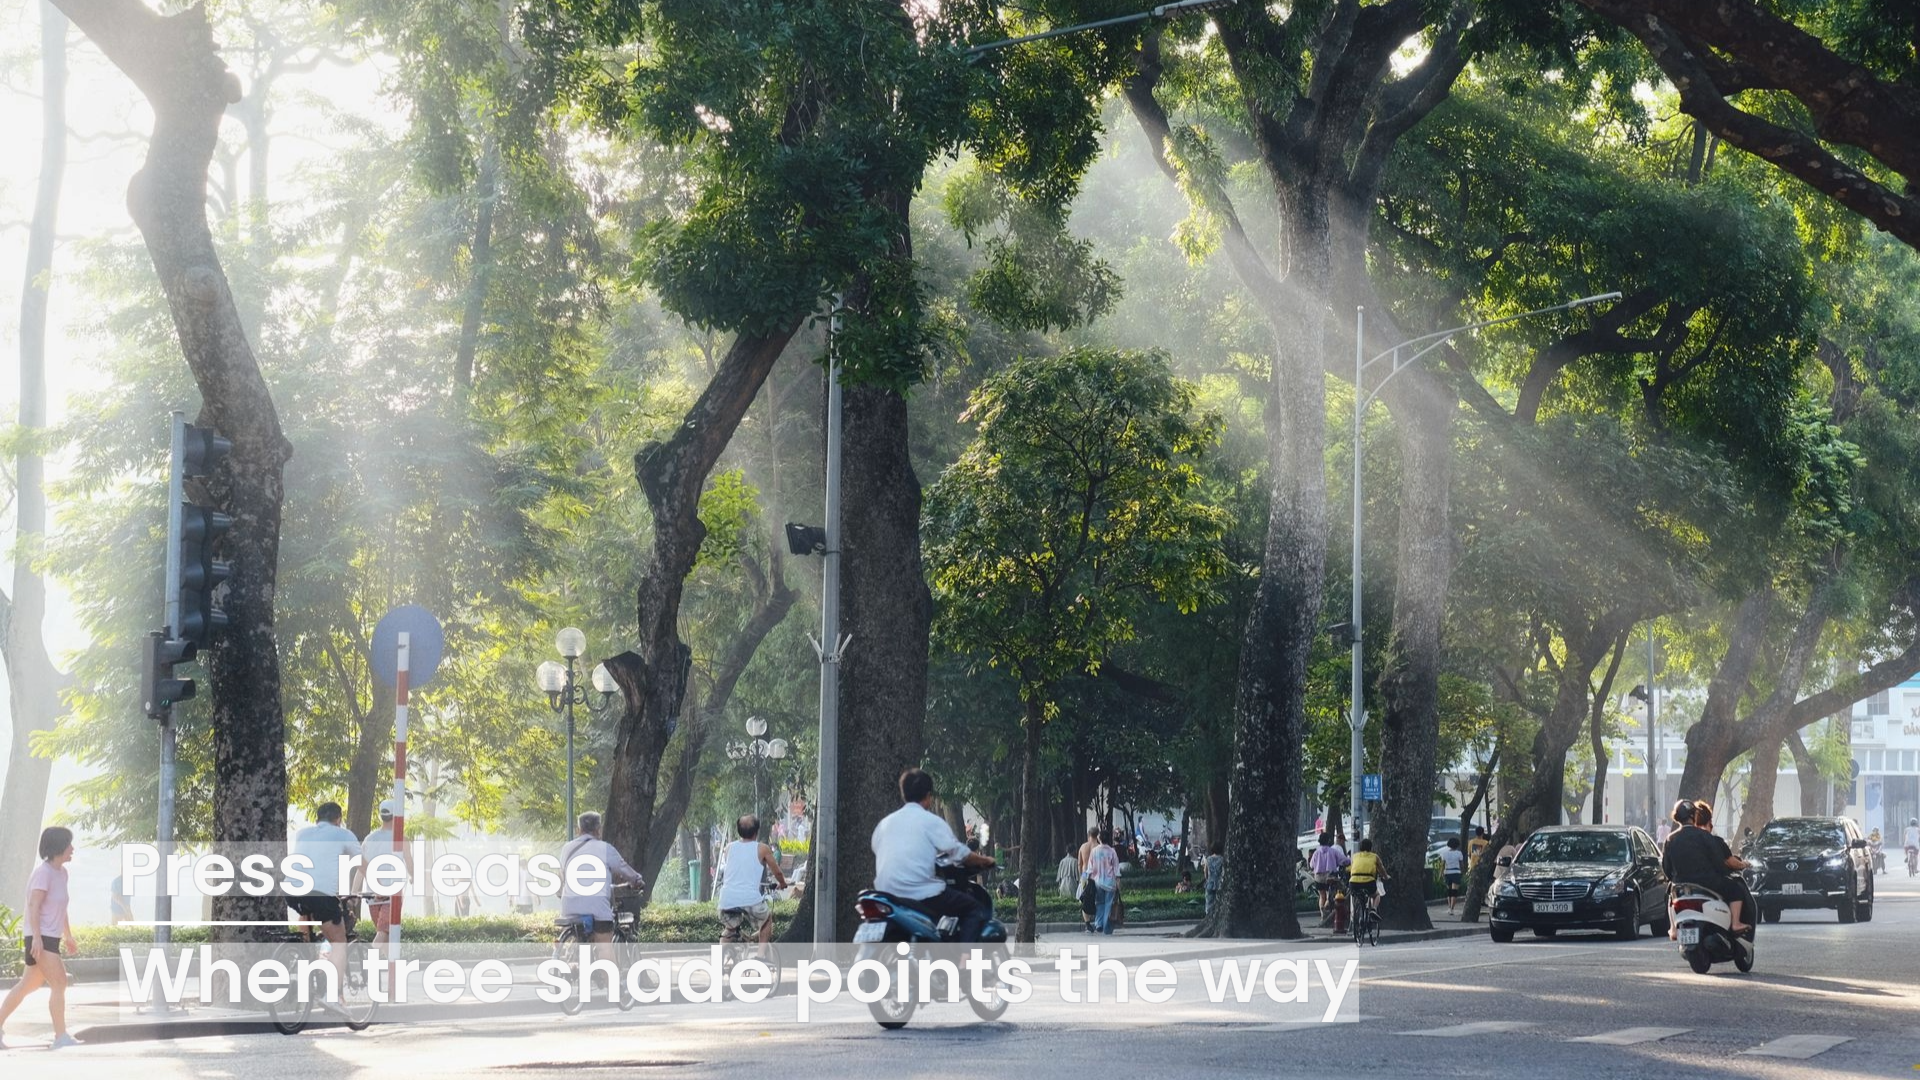
Heidelberg, 11.08.2026. In some city districts, more than a third of pedestrian streets sit under tree cover. In others, the figure is barely ten percent. To make such gaps visible and give cities a more differentiated view, HeiGIT (Heidelberg Institute for Geoinformation Technology) has added a new indicator to its existing Climate Action Navigator. Local governments and civil society organizations receive a free, street-level overview of where shade is present and where it is missing, so they can take targeted action such as planting trees or directing tourists toward shaded routes to attractions.
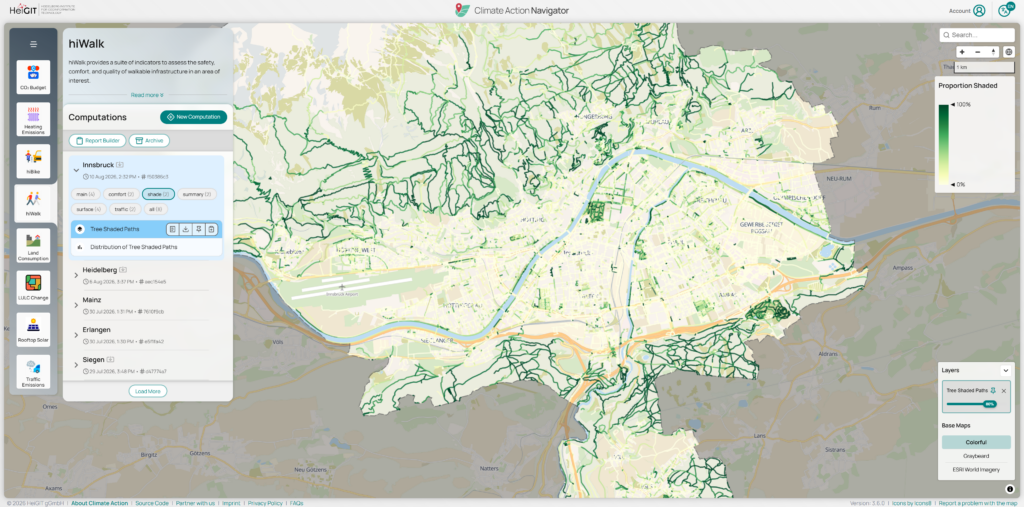
Tree shade has a substantial effect on the temperature of individual streets. Citywide averages are often coarse and can hide where residents are most exposed to heat on their daily routes. In Innsbruck, for example, tree cover reaches about 30 percent overall. Most of the shaded paths, however, lie outside the city center, while heavily used streets in the city itself are often left in full sun.
Shaded routes make the daily commute to school or work more pleasant, and they also indicate which neighborhoods remain livable as summer temperatures rise and which do not. Claudia Schmiedeberg of the GLEN Study adds: “Understanding how climate change affects society as a whole requires a close look at how local surroundings shape daily behavior and well-being over time. Linking the tree shade indicator with longitudinal survey data shows how urban environments influence decisions and how unevenly these effects are distributed across neighborhoods.”
Knowing where to act
The tool was developed at the request of urban planners and non-governmental organizations working on pedestrian-friendly city design. It gives municipalities a basis for deciding where new trees are needed and where existing tree cover already contributes to livable streets. Jim Walker from Walk21 Foundation notes: “This indicator gives us comparable numbers, street by street, so city administrations have the evidence to prioritize infrastructure investment where it will keep people moving through the hottest months”. Linking the tree shade data with school catchment areas, for instance, reveals which routes offer children more sun protection on their way to school than others.
How the indicator is calculated
The indicator analyzes where pedestrian walkways directly overlap with tree canopies standing two meters or taller, a height that separates real shade from low shrubs and ground cover. Simulating a high noon scenario when solar exposure is strongest, the tool measures shade at its weakest point of the day, giving planners a worst case benchmark for targeted interventions.
The same data and method apply everywhere, so a small town and a global capital can be measured on equal footing. Two contrasting examples illustrate this: In the historic city of Maribor, roughly 35% of the pedestrian network is covered by trees. Meanwhile, in the university hub of Tempe, Arizona, this figure is just above 7%. Cities can use this free and open tool to see where they stand and where to act next.
“We wanted to bypass the barrier of local data scarcity. With high-resolution global canopy datasets, we can offer any municipality a granular diagnostic tool for free. This democratizes access to information, allowing planners to target greening initiatives where they are needed the most,” says Dr. Kirsten von Elverfeldt, Community engagement manager at HeiGIT.
Everyone can access the dataset and see how their own municipality performs by visiting the Climate Action Navigator platform: https://climate-action.heigit.org/dashboard/
Contact person for Climate Action Navigator: Kirsten von Elverfeldt kirsten.vonelverfeldt[at]heigit.org