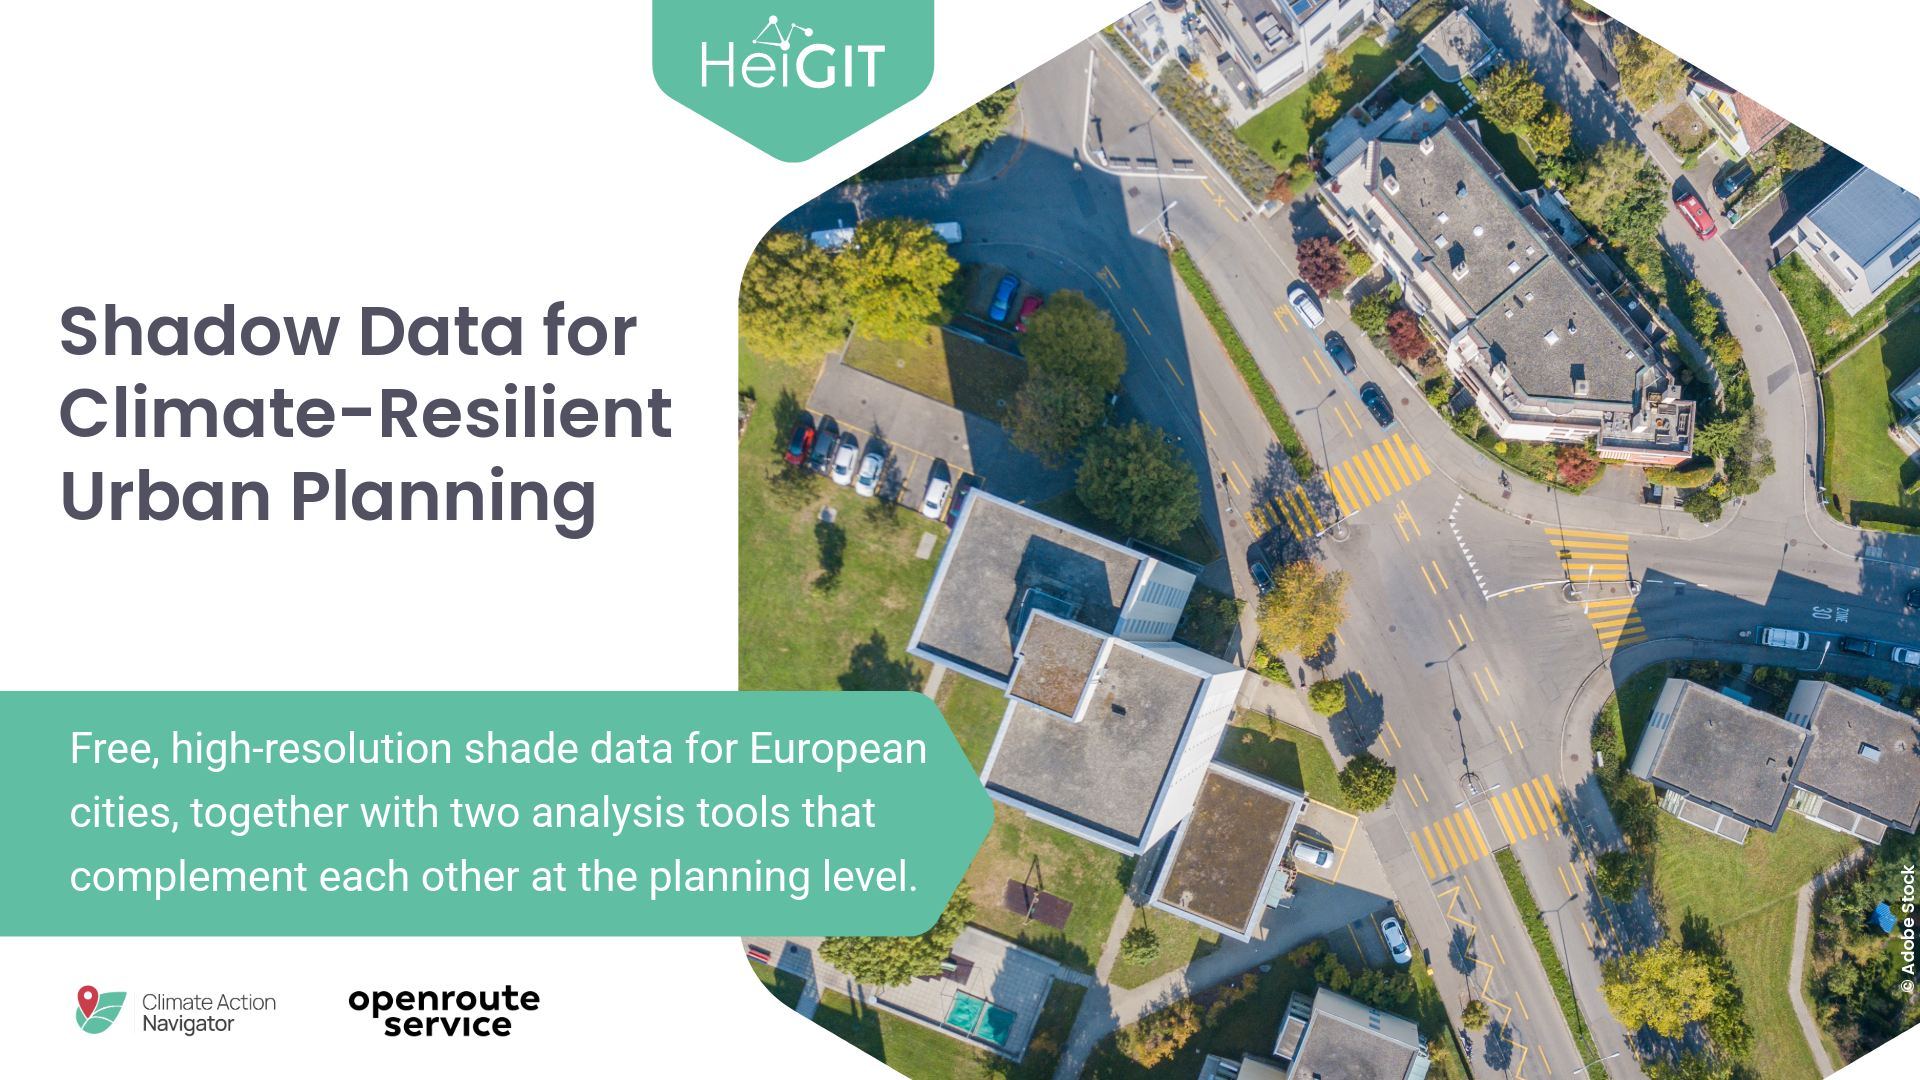
The 9 hottest summers are all in this century, and city administrations need evidence at street level in order to respond to the individual challenges of each neighborhood. We provide free, high-resolution shade data for European cities together with two analysis tools that complement each other at the planning level. Our hiShade plugin in the Climate Action Navigator shows how shade is distributed across a neighborhood. The shadow routing application calculates pedestrian routes that keep people out of the sun. Both draw on the same underlying database, which now covers 136 cities in 44 European countries.
Why shade has to be measured at the neighborhood level
Research on the urban microclimate shows that the built environment determines how heat is experienced in a city. Building geometry, street orientation, and tree cover regulate thermal stress at a block level. A municipality can report an overall good share of green space while its busiest pedestrian routes run in full sun for most of the day. Vulnerable groups such as older people, young children, and people with chronic conditions carry a greater health burden from the same heat. Past planning prioritized cars and road capacity over a changing climate, and many streets offer little shade as a result.
Planning departments therefore need data at the resolution at which they act. Decisions about where to plant trees, where to install shading structures, and which routes to recommend during a heat warning are made street by street. Data that resolves shade at that scale turns heat adaptation from a general objective into a city-wide visualization of its weak points.
hiShade shows where shade is missing
hiShade shows how shade is distributed across the walkable network of a neighborhood or an entire municipality, so districts that are structurally underserved become visible. The distribution can be viewed at four times of day, showing how it changes over the course of a day. That gives a starting point for targeted interventions, prioritizing areas where high solar exposure coincides with heavy pedestrian use.
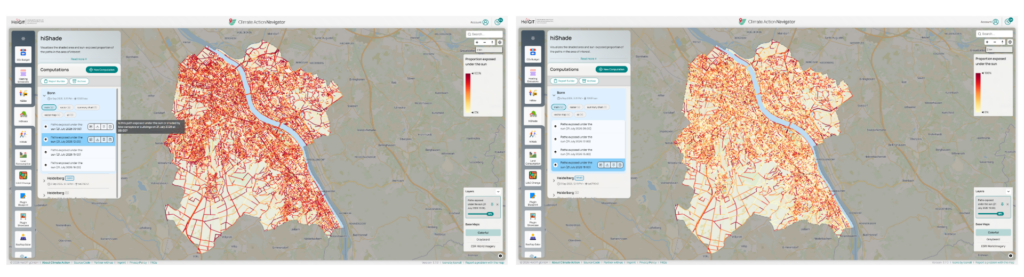
hiShade is one of several plugins in the Climate Action Navigator, an analysis platform for municipal administrations, non-governmental organizations, and citizen initiatives. It is publicly available and free to use. The hiWalk and hiBike modules on the same platform assess the quality of walking and cycling infrastructure, including surface condition, comfort, and greenery, so shade can be read together with the rest of the pedestrian environment.
Heat avoidant-routing supports active mobility during summer months
The shadow routing tool applies the same shade data to the pedestrian network and calculates routes that steer away from sun-exposed streets. This demo version is an analytical instrument for examining heat exposure in the walking network. Enriched with city-specific data such as sensor measurements, it can also yield insights into the local microclimate.
City administrations or planning offices can use it to answer questions like:
- How large the detour becomes when a pedestrian prefers shaded corridors, and which parts of the city impose the longest detours.
- How well schools, care homes, clinics, and public transport stops can be reached on shaded paths during a hot afternoon.
- Which connections offer no shaded alternative at all, which marks them as candidates for intervention rather than for a route recommendation.
- Which routes to recommend to residents, visitors, and event traffic while a heat warning is in effect.
Shade is pre-computed for four times of day across four summer months, so the analysis distinguishes a school run at nine in the morning from the walk home at three in the afternoon, when the same street offers different protection. The shade share of each segment enters the calculation as a weighting factor, and the routing runs on openrouteservice, our open source engine built on the OpenStreetMap street network.
Coverage across Europe
The dataset covers 136 cities in 44 countries, with 83 of them being in Germany. The current release adds 53 cities in 43 further countries, each represented by its capital, joined by cities of more than one million inhabitants and, within Austria, by Graz, Innsbruck, Linz, and Salzburg. Because solar exposure is calculated the same way everywhere, cities can compare their exposure patterns with one another rather than against a locally tuned model.
Scaling the approach
The German release relied on Digital Surface Models and Digital Terrain Models from the state surveying offices. Outside Germany, comparable data exists in some countries and is missing in others, and where it exists it differs in resolution, acquisition date, license, and file format. Building a European shadow dataset on more than 40 separate national data policies would limit the transferability of the method, so we combined several global datasets instead. We also rewrote the shade calculation itself in Rust, which cut the runtime per city far enough to make a service at European scale reasonable.
The pre-processing pipeline generates a 1 m synthetic nDSM. It combines three inputs:
- Building polygons from TUM, which supply structure heights
- CHMv2 canopy height data, which supplies vegetation heights at 1 m resolution
- A global 30 m Digital Elevation Model from Mapterhorn, which supplies the ground reference
The output estimates the height of buildings and vegetation above the ground surface. The trade-off is that every height in the raster is an estimate. Accuracy depends on how complete building height information is in a given city and on how well the canopy model performs in dense built-up areas. If a city publishes measured high-resolution DSM and DTM data and we did already discover this, that data remains the better input, and the pipeline uses it in place of the synthetic layer.
Pre-computing the shade
We first calculated shade with r.sunmask.datetime from GRASS GIS. The tool is reliable and was fast enough for individual cities, but not for the number of runs a European service requires. To scale the approach, we reimplemented it in Rust, which reduced the runtime per calculation far enough to make the full set of runs practical.
The sun moves across the sky over the course of a day, and its path also shifts over the year, running higher in summer and lower in winter. That path is nearly symmetric around the summer solstice, so a handful of sampled dates covers most of the variation. We calculate shade for 21 May, 21 June, 21 July, and 21 August, at 09:00, 12:00, 15:00, and 18:00 CEST.
Working with cities on what comes next
This release is a living product rather than a finished service. It shows that shade analysis and shade-based routing work without sensor infrastructure and without national elevation data, and that they can reach any city. The same pipeline can be extended beyond Europe and to smaller municipalities.
We invite cities and communities to co-create the tools so that they meets their data needs. Municipalities with measured high-resolution DSM and DTM products, with sensor networks, or with local temperature measurements can have that data integrated, which produces routing and analysis reflecting local climate structure. Cities without existing data can shape the roadmap by defining what they need.
We welcome inquiries and ideas for collaboration from cities, planning offices, and civil society organizations at heal[at]Homepage .
Related publications
Huber, J., Ludwig, C., Foshag, K., Kolaxidis, N., Zipf, A., & Lautenbach, S. (2025). Accessibility for pedestrians under heat stress: The example of Heidelberg, Germany. AGILE: GIScience Series, 6, 4. AGILE-GISS – Accessibility for pedestrians under heat stress – the example of Heidelberg, Germany
Kolaxidis, N., Ludwig, C., Knoblauch, S., Fürle, J., Foshag, K., Fendrich, S., Lautenbach, S., & Zipf, A. (2025). Mitigating heat stress by reducing solar exposure in pedestrian routing. Transactions in GIS. Advance online publication. Mitigating Heat Stress by Reducing Solar Exposure in Pedestrian Routing