The ohsome Country Quality Report now covers schools and hospitals
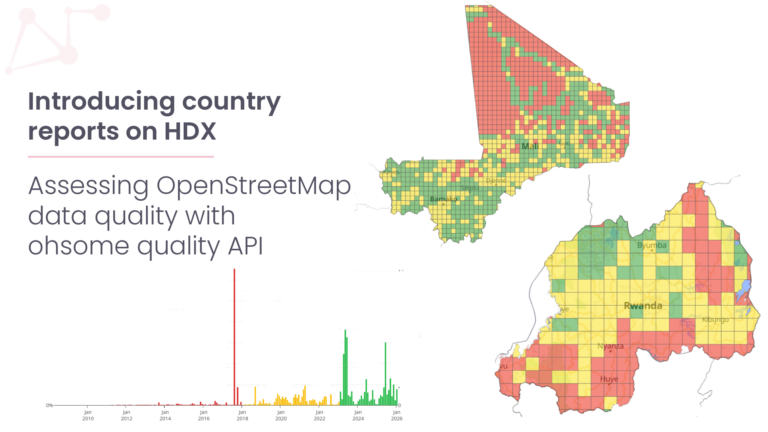
In May, we introduced the ohsome quality API (OQAPI) country reports, which provide an overview of whether OpenStreetMap (OSM) data in a country is fit for purpose. Since then, a lot of work has gone into both the dashboard and the pipeline behind it. We have now released an updated version of the dashboard.
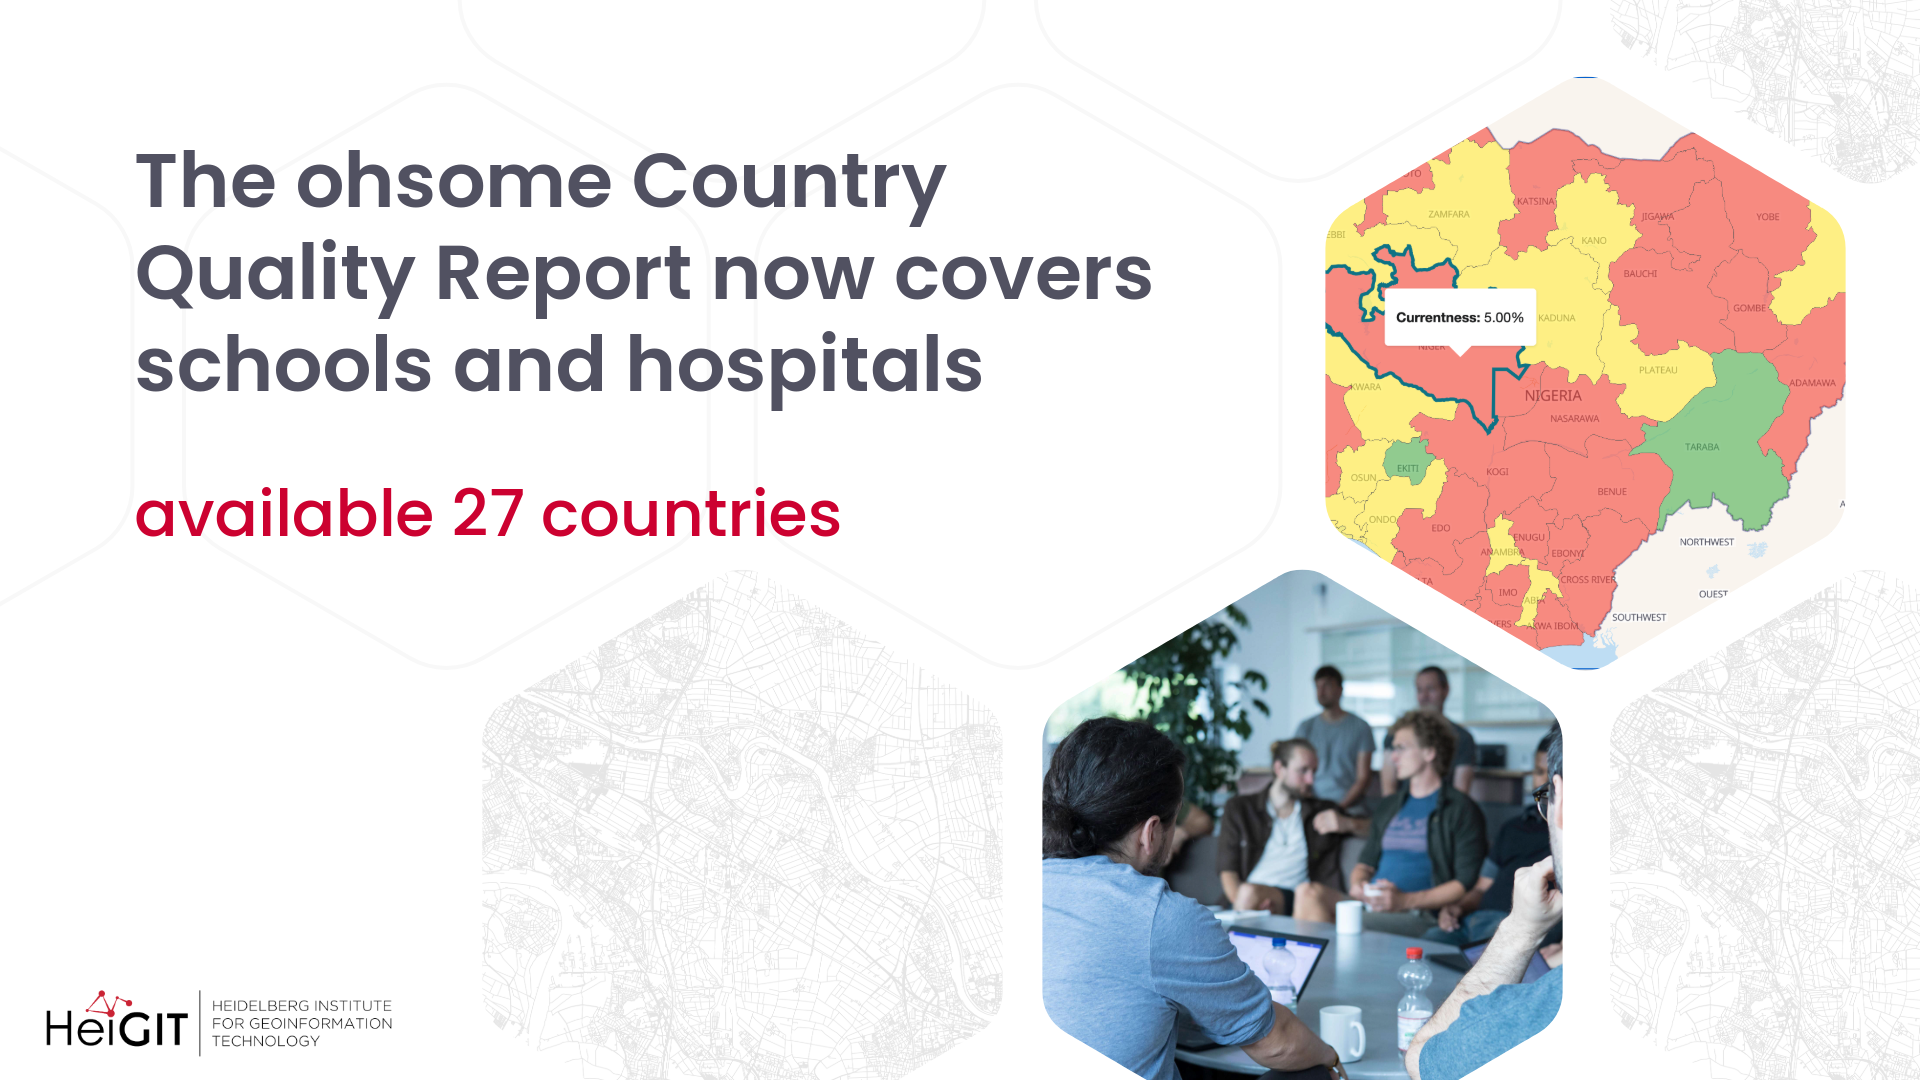
The updated ohsome Country Quality Report covers 27 countries and five topics: buildings, roads, schools, hospitals and land cover. Last time, we promised to go beyond roads and buildings and add health and education. With schools and hospitals, that is now live.
What has changed in the dashboard
Country, layer, topic and indicator are now selected in one sidebar on the left, while the map and charts take up the main view. You can switch between the different aggregation levels. Click on any region on the map and every number, gauge and chart show the values for that region. One click takes you back to the whole country.
In addition to mapping saturation, currentness, attribute completeness and user activity, each topic now also comes with a tag distribution. A treemap shows swhich kinds of buildings, roads or land cover make up the data, including features without a value.
Attribute completeness can now be checked per attribute. Pick, for example, name, maxspeed or surface for roads, or emergency and opening hours for hospitals, and the map updates right away.
For Germany, the dashboard also includes indicators that compare OSM with official reference data: building comparison, roads thematic accuracy, land cover completeness and land cover thematic accuracy.
Open source and open data
We have also rebuilt the processing pipeline that produces the dashboard data. It is built on Dagster and calls the ohsome quality API and the ohsome API for each country, topic and indicator. Both the pipeline and the dashboard frontend are open source on GitHub.
All results are also available as open data on Humanitarian Data Exchange (HDX). Each country has its own dataset, “\[Country\] – OSM Data quality”, with the interactive country report embedded right on the dataset page.
Try it out
Pick a country, choose a topic and see how well OSM represents it. Whether you plan a health facility assessment, check road data before routing, or look for areas where mapping is still needed, the country reports give you a quick starting point.
We will keep adding countries and topics. If your country of interest is missing, or you are using the reports in your work, we would love to hear from you at technical-innovation-group@heigit.org.
Stay tuned!
The dashboard: ohsome Country Quality Report
The datasets on HDX: HeiGIT OSM data quality on HDX