“Local Knowledge” is constituting the exceptional value of Volunteered Geographical Information and thus also considered as an important indicator of data quality. We are interested in how much local information is captured in OpenStreetMap data. In this blog post we explore the temporal evolution of mapping in OSM and the information stored in its database, by taking an explorative look at four different cities in Germany, Nepal and the Philippines: Heidelberg, Kathmandu, Pokhara and Manila.
Heidelberg is generally considered to be relatively well mapped and has experienced mapping activity over a decade for now. Mapping in Kathmandu has been impacted heavily by data created for disaster response in the aftermath of the 2015 earthquake disaster in Nepal. This resulted in a significant increase in activity from mappers around the world. As comparison, we also will take a look at Pokhara. Pokhara is Nepals second largest city and lays approximately 200 km west of Kathmandu and belongs to the more rural part of Nepal. Manila is the capital and the economical and cultural center of the Philippines.
The image below shows a potential classification of OSM data in regard to the types of information it might contain. This is mostly targeted towards a humanitarian mapping context and may need adaptation for a more general evaluation of mapping phases, but we use it here as an example only. While buildings and road network completeness are of interest for level 0-1 (mostly based on remote mapping such as in international humanitarian mapathons, the further levels 2-4 are considered to source from local knowledge.
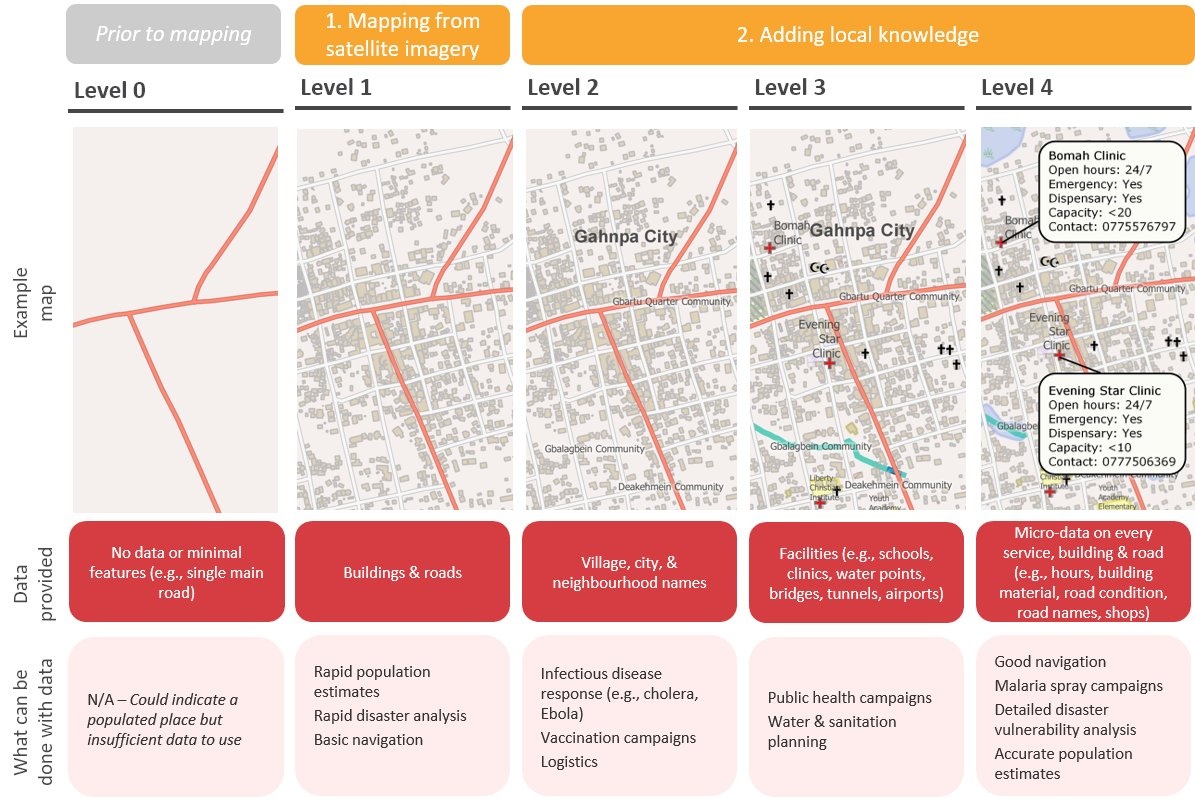
Fig. 1: Image from Twitter post by Rebecca Firth from HOT
In the following we will compare different aspects of development of OSM Data, including
- completeness of road network and buildings (level 0-1)
- exploratory analysis of local information for facilities and POIs (level 3)
- overall information richness (level 4)
Examining this evolution should give us some insights on how long it takes volunteers to provide local information (especially in a context where mapping started with remote mapping) and how far the process is at the different locations. In order to perform this analysis the ohsome API by HeiGIT was utilized to access the OSM full history data. The API provides different endpoints to extract and aggregate data about the objects, users and single contributions.
Level 0-1: Roads and Buildings
Road network
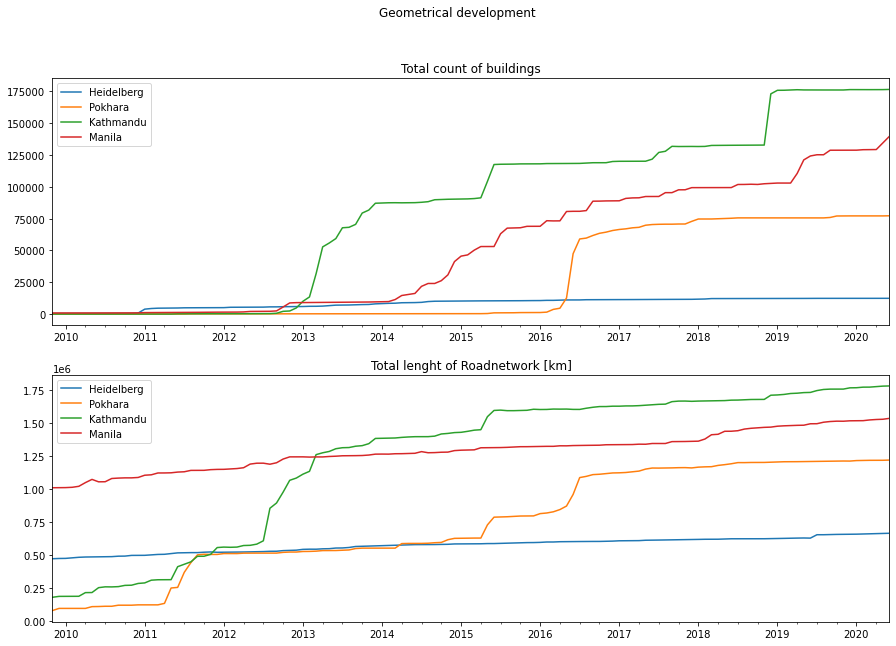
Especially humanitarian mapping in OSM often started with roads and buildings, which can be traced remotely from satellite imagery. The situation is different in areas where there is already an existing strong OSM community for a longer time. For example in total, over 1.75 million kilometers of highway were mapped in Kathmandu. The related graph shows clearly the impact of the 2015 earthquake: the road network increased by approximately 15% directly after the disaster and by 30% until today. Pokharas increase since the earthquake is even bigger, with doubling its mapped length of highway objects since when. Especially two spikes are noticeable: one in the direct aftermath of the earthquake and one in the year 2016. The development of Heidelbergs road network length, showed in contrast a more constant development, with a small growth rate over the last decade. Manilas road network showed seemed to be still in the phase of active mapping: its length increased by approximately 7% over the last year.
Buildings
The mapping of buildings in comparison to the length of the road network showed a slightly delayed development. After initial mapping of buildings in 2011, only very few buildings were mapped in Pokhara until about one year after the earthquake. Afterwards the number of mapped buildings showed a rapid growth over a few months in the second quarter of 2016. Kathmandu showed three main growth events: one in the end of 2012, marking the first noticeable amount of contributions, one directly following the earthquake in 2015 and another smaller one in 2019. Manila showed a steady data evolution, with the exception of one spike in 2019 which indicates that similar to the road network buildings are still not mapped completely.
Level 3: Temporal Evolution of Facilities and POIs
Facilities
The third level is characterized by information about facilities. Here we take a look at the temporal development of educational facilities, access to drinking water, healthcare facilities and information about the road network (in this case bridges and tunnels). The plot below shows the total count of objects belonging to these groups.
While Heidelberg showed a more or less constant behavior, the 3 other cities showed a more irregular growth pattern. Manila experienced a steady increase over the last 10 years, which further accelerated in the last one to two years. This indicates an ongoing mapping of facilities and infrastructure. Kathmandu’s graph showed a strong increase between 2012 and 2013 and has since experienced irregular phases of growth which slowly leveled out recently. Notable is, that the 2015 earthquake response mapping didn’t had a significant impact on this development. Pokhara’s development, started slow and has grown between 2016 and 2018, before leveling out afterwards.

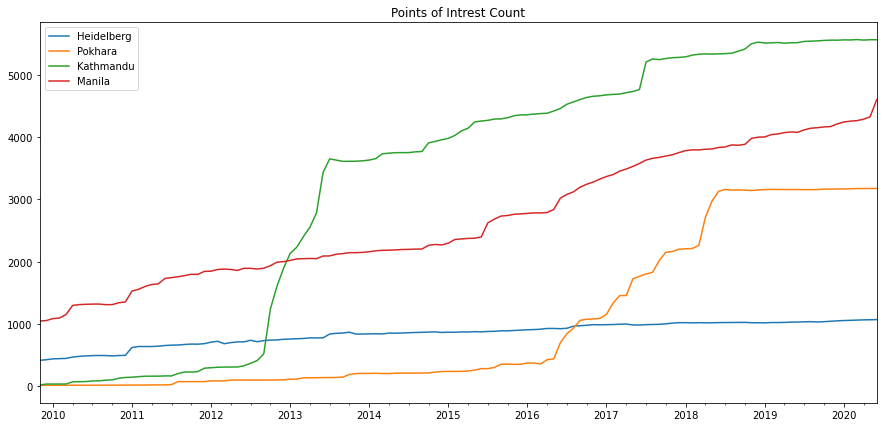
Point of Interests
As point of interest (POI) we consider objects containing the tags name and amenity. The amount of those are of interest to understand the amount of information besides geometries, facilities and critical infrastructure. A comparison to the development of roads and buildings indicates that the mapping of POIs followed the mapping of essential map features like buildings and roads. In particular the development for Kathmandu and Pokhara, which experienced short concentrated periods of highway and road mapping, showed a delayed evolution in regard to the mapping of POIs. This might indicate that mapping buildings and roads and mapping POIs were two separate processes. Manila and Heidelberg showed at least some form of co-occurence between the mapping of buildings and roads and the mapping of POIs which might indicate a simultaneous mapping process of the different features.
Level 4: Overall Information Richness
Temporal Evolution for Buildings and Roads
Following the scheme above, the main characteristic of the fourth level is a high amount of stored information in the objects in the map. We will take a look at the number of additional tags per object. For definition of Richness of VGI data see Ballatore & Zipf (2015).
The graph below shows clearly that the amount of additional tag information in Heidelberg is very high for roads and buildings. For instance, more than 50% of the buildings contain five or more tags. Manila, Kathmandu and Pokhara had a significant lower portion of buildings and streets containing additional information. An exception was the road network of Manila which was comparable to Heidelberg.

Conclusion
Mapping patterns in Kathmandu and Pokhara were clearly distinct from those in Heidelberg, both with respect to the temporal development of buildings and roads and the amount of tags. This indicates that a lower amount of local knowledge was present in the OSM data of the two cities. Mapping in Manila showed at least some resemblance in comparison to the development of Heidelberg, but also contains overall less information yet and the buildings and road network are still undergoing constant mapping.
In case you are interested to learn more about ohsome take a look at the How to become OHSOME series or take a look at the literature below. In case you want to take a look at a region of your choice, just add your bounding box in the cell of the jupyter notebook and rerun the cells.
Links:
OSHDB and ohsome API git repositorys
Humanitarian OSM Stats Global statistics for Humanitarian Open Street Map Team projects
ohsome HeX- Open Street Map History Explorer
Literature
Raifer, M., Troilo, R., Kowatsch, F., Auer, M., Loos, L., Marx, S., Przybill, K., Fendrich, S., Mocnik, F.-B.& Zipf, A. (2019): OSHDB: a framework for spatio-temporal analysis of OpenStreetMap history data.Open Geospatial Data, Software and Standards 2019 4:3. https://doi.org/10.1186/s40965-019-0061-3
Auer, M.; Eckle, M.; Fendrich, S.; Griesbaum, L.; Kowatsch, F.; Marx, S.; Raifer, M.; Schott, M.; Troilo, R.; Zipf, A. (2018): Towards Using the Potential of OpenStreetMap History for Disaster Activation Monitoring. ISCRAM 2018. Rochester. NY. US.
Grinberger, A. Y; Schott, M; Raifer, M.; Troilo, R.; Zipf, A. (2019): Analyzing the spatio-temporal patterns and impacts of large-scale data production events in OpenStreetMap In: Minghini, M., Grinberger, A.Y., Juhász, L., Yeboah, G., Mooney, P. (Eds.). Proc. of the Academic Track at the State of the Map 2019, 9-10. Heidelberg.
Ballatore, A. and Zipf, A. (2015): A Conceptual Quality Framework for Volunteered Geographic Information. COSIT – CONFERENCE ON SPATIAL INFORMATION THEORY XII. October 12-16, 2015. Santa Fe, New Mexico, USA. Lecture Notes in Computer Science, pp. 1-20.
, , . Regional variations of context‐based association rules in OpenStreetMap. Transactions in GIS. 2020; 00: 1– 21. https://doi.org/10.1111/tgis.12694