Welcome back to another ohsome blog post. Today, we will present the results of a recent analysis performed by our student assistant Jascha, who took a look at the distribution and development of farm shops (in German: Hofläden) at different scales in OpenStreetMap (OSM). This analysis is based on previous work within the german climate protection map. It allows its users to find relevant information about the topics energy supply, mobility, as well as nutrition and consumption. You can read more about it in this blog post.
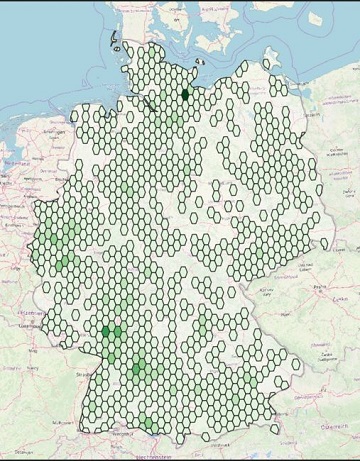
Back on track, let’s take a look at the analysis and its results. The following gif shows the distribution of farm shops from 2009 to 2019 of Germany in a hexagonal grid. Whilst at the beginning of 2009 only about 20 hexagons had features with the tag shop=farm, almost the whole of Germany was covered ten years later.
klick the picture to see the animated gif
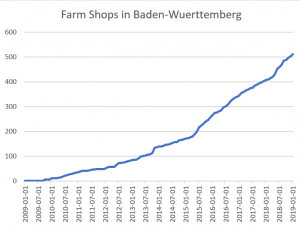
If you are also interested in creating such a gif, you should read the blog How to become ohsome part 1. As usually, if you want to take a look at the exact request parameters and curl commands, we’ve prepared a snippet for you. The next visualization shows a diagram covering the development of farm shops in Baden-Württemberg in the same time frame of ten years, measured on a monthly basis. You can see a constant increase over the whole time period, similar to the gif of Germany showed above.
This pattern does not always apply though, which we see when we take a closer look down to city level (in this example the city of Heidelberg). Here, we’ve compared the mapped farm shops in OSM with official values from the city of Heidelberg in the given time frame. For getting the temporal aspect into that data set, we’ve contacted each farm shop and asked about their start/end dates, hence the visible temporal differences in the values. The following diagram shows these two measures:
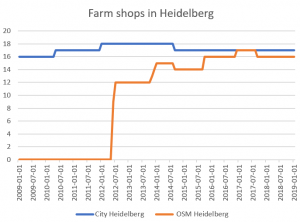
The first mapped farm shop of Heidelberg in OSM was in June 2012. Interesting side-note: In this month, all nine new mapped farm shops in whole Baden-Württemberg where mapped in Heidelberg. When taking a closer look at the diagram, both data sets had the same number for roughly half of 2017. At any other time period, they were different. This could be, for example due to different tags being used for the OSM features, like amenity=marketplace, which also appears nine to ten times in Heidelberg from the first of July 2012 onwards.
To wrap it up, this small analysis shows that the attention for regional shopping and products is also reflected within OSM. On a regional and country-level scale, the data is still increasing, whereas on some city levels, like Heidelberg, it already seems to be quite complete. Further analysis looking deeper into the OSM data set would be necessary to precisely measure the (attributive) completeness of specific feature categories, for which the ohsome API can deliver the necessary functionalities. The next ohsome blog post will cover a new feature of the API, which should make your requests simpler. As always, you can reach us via info@heigit.org. Stay ohsome!