Extreme natural events create catastrophic situations for cities and their populations. Due to climate change and anthropogenic activities, the number and intensity of these events has steadily increased at the global scale. Floods are the most common natural disaster worldwide, responsible for economic, social and life losses. Low-income countries have a death rate 23 times higher than countries with high financial resources and are therefore much more affected by the impacts.
Isabell Klipper studied how the 2013 flood in Jakarta, Indonesia affected the connectivity of the road network and accessibility to clinics and hospitals. The analysis was based on two connectivity indicators (betweenness centrality and harmonic closeness centrality) as well as on the isochrones functionality of the openrouteservice. In addition to OSM data flood data – kindly provided by HOT Indonesia – was used.
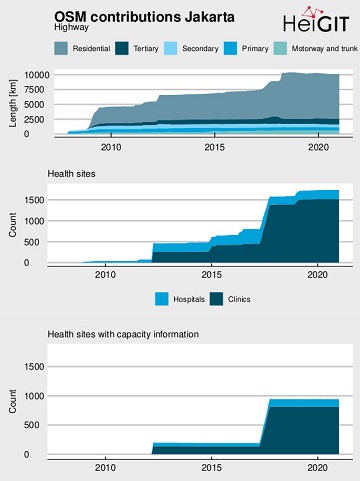
An intrinisc data quality analysis based on the ohsome API revealed a sufficient completeness for road infrastructure and clinics and hospitals. Bed capacity was available for ~60% of the hospitals and ~54% of the clinics.
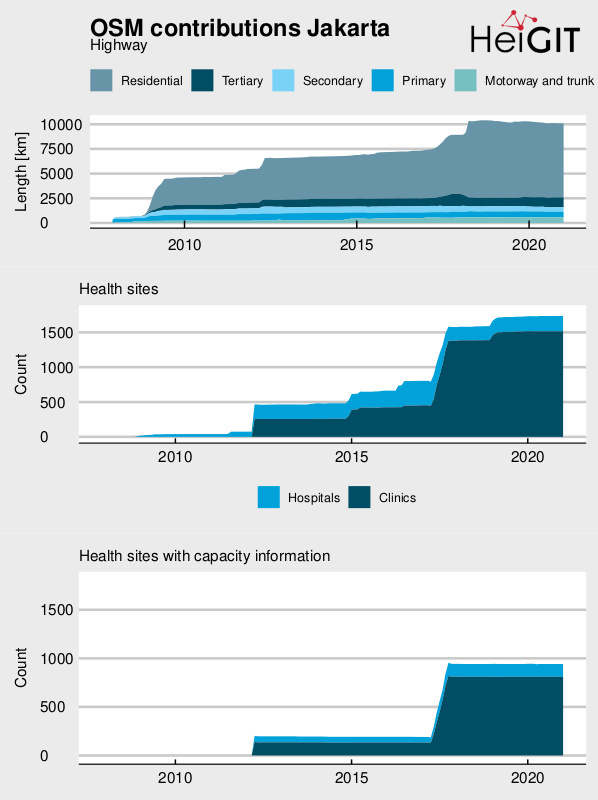
OSM contributions for road network and health sites in Jakarta.
Betweenness centrality (BC) denotes the fraction of shortest paths which pass through the focal node between all node pairs. The higher the betweenness centrality value of a node, the more important the node in the network. Since travel times were used as weights, the BC measured the frequency at which the respective nodes were approached or crossed on the fastest routes. Nodes with a high betweenness value are crossed more frequently and are in this context important for a fast routing and traffic flow. An even spatial distribution of betweenness values indicates a resilient road network, since the maintenance of traffic does not depend on individual nodes and is therefore not affected by the failure of individual sections. A doubling in value implies that the node is passed twice as often.
Closeness centrality (CC) counts the reciprocal of the average distance from a specific node to any other nodes within the network. Since the classic formula cannot be used for disconnected graphs the harmonic closeness centrality was used. Nodes with a higher HC are closer to all other nodes and can therefor be reached by others best. In contrast to the BC, the results of the HC indicate which nodes can be reached most quickly on average for all existing nodes. Nodes with a higher closeness rating can therefore be regarded as important supply points as well as locations which can be reached quickly by all other nodes.
Nearly a quarter of all nodes and 25 percent of the edges were affected by the flood event, which split the network into one main graph and several subgraphs. 34,027 nodes, which were flooded and therefore no longer passable. Effects of the flood event on betweenness centrality where relatively small. A few nodes in the center of the city gained in betweenness centrality but on average the value decreased slightly from 0.00004 to 0.00002. Most of the nodes (~75 percent) did not change in value or only changed by a small amount of -/+0.0005, which means that these nodes had an increasing or decreasing traffic volume of up to 0.05 percent.
Effects of the flood event on HC were a bit more pronounced than for BC. More than 60 percent of the remaining 111,379 nodes changed their HC value by less than -/+0.2, which indicates that most of the nodes and the major part of the network, respectively, maintained its functionality regarding fast access. Strongest losses in HC value occurred in nodes located near the city border. On average the HC value decreased from 0.25 to 0.13.

Histogram of BC and HC values for normal conditions and the flood event. The dashed lines represent the mean of the distribution: grey: normal, black: flooded – for betweenness centrality the two lines cannot be distinguished due to the small difference in mean.
Under normal conditions almost the entire area of the city of Jakarta had access to at least one hospital or one clinic within a 10 to 15 minute car drive. The flooding had direct as well as indirect impact on accessibility. Directly affected were those areas which were actively flooded and therefore no longer passable – in total 2.75 million inhabitants were living in those areas. Indirectly affected were those areas which still have access during a disaster compared to the normal scenario, but which required a longer journey time to the nearest hospital. In total 1.36 million inhabitants were affected by an increase in travel time to the nearest hospital due to indirect effects of the flood event from up to 5 minutes to 5 to 10 minutes and 140,000 by an increase from 5 to 10 travel time to 10 to 15 minutes. With respect to the travel time to the nearest clinic the increase by indirect effects was less severe: around 60,000 inhabitants had to face an increase from up to 5 to 5 to 10 minutes.
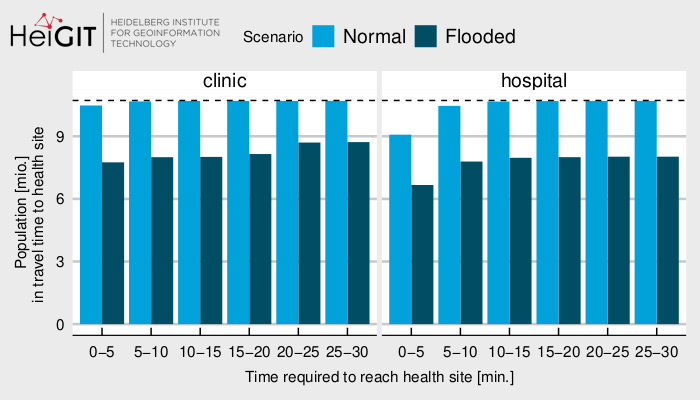
Amount of city population with healthcare access within specific time range: (left) access to at least one hospital, (right) access to at least one clinic.
The main roads near the city center provide under normal conditions access values of up to 10,000 beds within a 5-minute car drive. Bed availability in a five-minute drive decreased towards the administrative boundary. The flood, which was very pronounced in the north, leaded to a high loss of active supply. In addition, areas along the main transport axes were severer affected than the city center. The area east of the city center along the north-south main road experienced a reduction in the northern region by more than 0.1 beds per person per square kilometer. In the southern section, the flood caused changes of varying intensity. The area along the road junction, which connects the main roads running north-south and east-west, was predominantly affected by a change of -0.08 to more than -0.1 beds, whereas an increasing distance was associated with a lower decrease of -0.02 to -0.04 available hospital beds per person per square kilometer accessible within a 5-minute car drive. The area in the northern part of the city, between the directly flood affected areas, and the bordering area in the south (-0.02 to -0.04) was heavily affected, too, with a decrease of partly more than -0.1. The fourth heavily impacted region is located in the southwest in the outskirts of the city, along the main road, with a decrease in bed capacity per person per square kilometer of around -0.06 to -0.1.
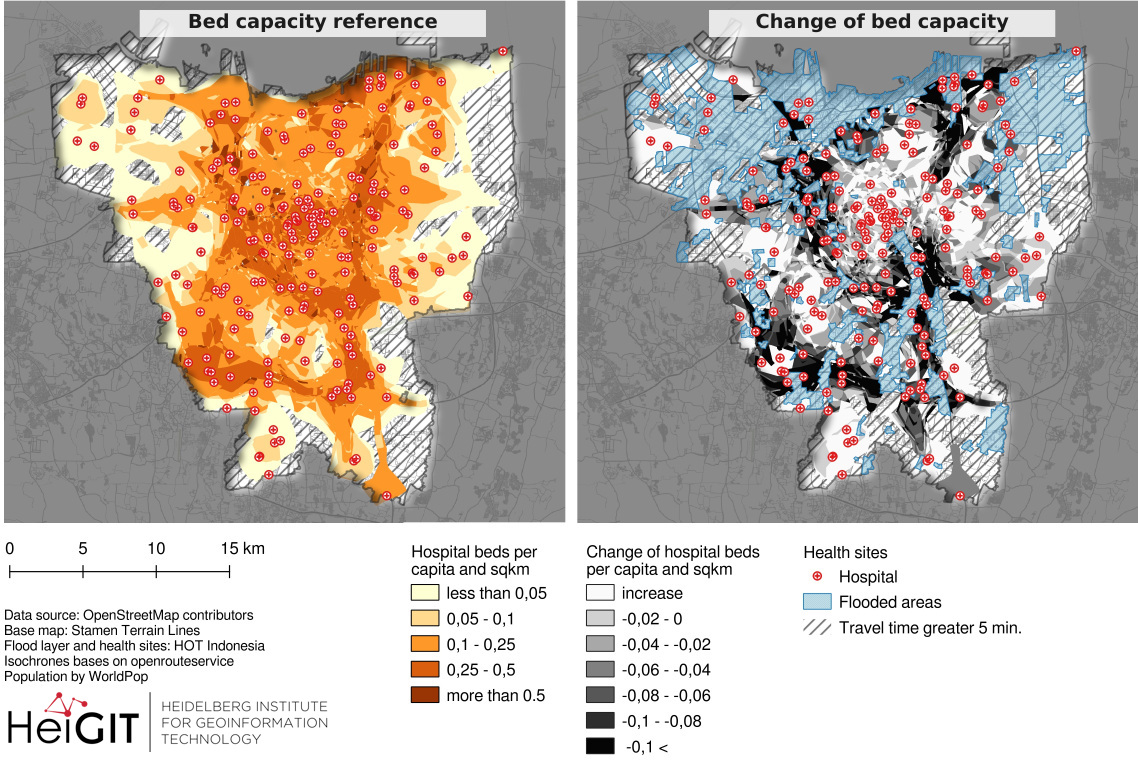
Cumulative amount of available hospital beds per person per square kilometer accessible within a 5-minute car drive.
The master thesis as well as the code for the analysis is available on github.
Related Work:
- Updated OSM Healthcare in Senegal (2020)
- Accessibility of covid-19 vaccination centers in Germany
- Recent changes to OpenStreetMap healthcare infrastructure in India
- Exploring OSM for healthcare access analysis in Sub-Saharan Africa
- Analysing OSM Completeness of health facilities in Sub-Sahara Africa in ohsomeHeX
- Geldsetzer, P.; Reinmuth, M.; Ouma, P. O., Lautenbach, S.; Okiro E. A.; Bärnighausen, T.; Zipf, A. Mapping physical access to health care for older adults in sub-Saharan Africa and implications for the COVID-19 response: a cross-sectional analysis. The Lancet Healthy Longevity. 2020;1(1):e32-e42.
- Openrouteservice API: https://openrouteservice.org/
- New Jupyter Notebook: Analysis of Access to Health Care using openrouteservice Isochrones API
- Recent changes to OpenStreetMap healthcare infrastructure in India
- Mapping physical access to health care for older adults in sub-Saharan Africa and implications for the COVID-19 response: a cross-sectional analysis
- Find the route to your nearest Covid-19 vaccination center in Germany — new App by HeiGIT based on OpenStreetMap and openrouteservice
- Accessibility to pharmacies in Germany with 15km Covid-19 restriction
- Neis, P. & Zipf, A (2008): OpenRouteService.org is three times “Open”: Combining OpenSource, OpenLS and OpenStreetMaps. GIS Research UK (GISRUK 08). Manchester.