Welcome back to a new installment of the ohsome Region of the Month blog series! This will be part two our posts on hiking related tags and this time, we’ll investigate the connection between user activity and said tags. To do this, we’ll use mountain time as a reference area and incorporate insights from part one of this series (find it here). If this post sparks your interest, make sure to check out our other blog posts including this personal favorite covering coastal lengths. We also have some fantastic content on the functionalities of the ohsome API, including the How to become ohsome series.
Now, let’s get started!
Data
As in our previous work, we added input geoJSON and other information to a snippet for your convenience. The data used can be found here.
These are the filter conditions used in our requests:
format=csv
filter=type:way and (highway in (path, track, footway) and not footway in (sidewalk, crossing))
time=2007-12-01/2022-05-01/P1M
Two requests were sent, one to create each figure, and the endpoints used are: /elements/length & /contributions/count
Andes
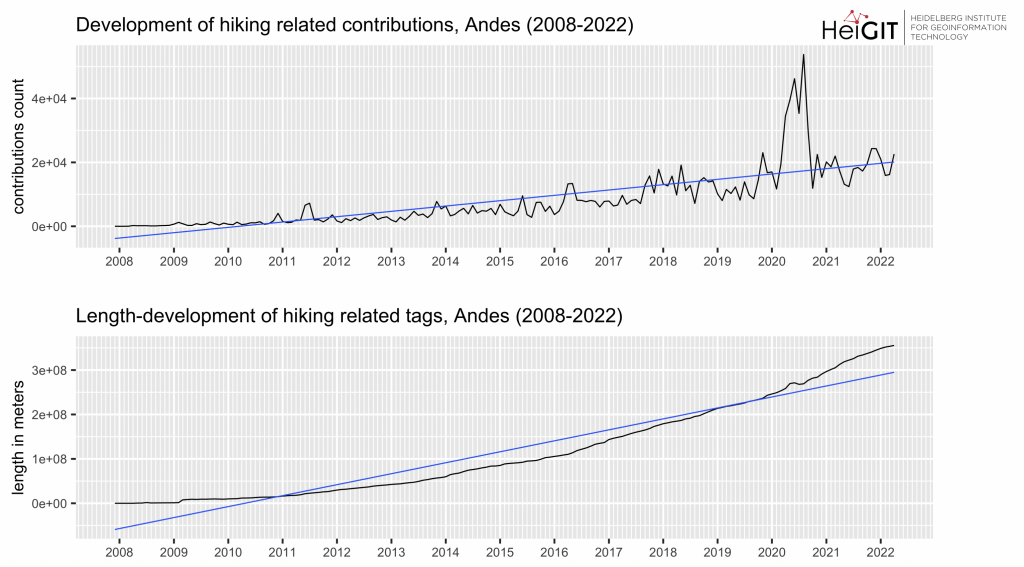
In the figures above and following in the blog post you can see the development of length and contribution count values on a monthly scale (black line) as well as a linear trend line (blue line).
For the Andes, there is an upwards trend with usually increased contribution activity for the months of April through August. There are also no particularly prominent changes in length with the exception of the 2008-2009 period, when there is a fairly large increase. This is possibly related to an early forming of the mapping community. The slope of the graph increases over time, as also reflected in the linear trend. The rather strong increase in length starting in 2021 could potentially be related to an ongoing address import for Chile.
Appalachian Mountains
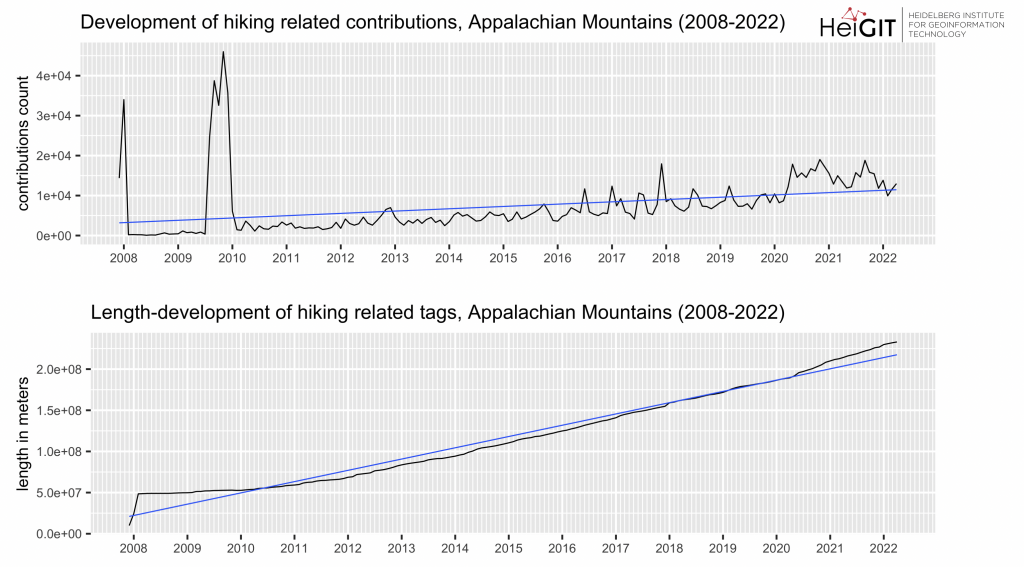
Beginning in July 2009, a very large increase can be seen for about half a year, followed by a drop to the previous level. Around April 2020, values are noticeably higher as the contribution activity increases on average. Although there is not an “ideal” seasonal pattern, there is often an increase over spring and the summer months, whereas the values drop more often throughout November and December. Increased activity over the summer months can be found, for example, in the years 2009, 2012, 2015-2018 and from 2020. As mentioned at the start, the values are permanently increased.
The length values rise enormously directly in the beginning 2008 and remained steady for the rest of 2008, this development is visible in the contributions graph as well. However, the is a second peak within the contributions graph around the end of 2009 which is not displayed in the length graph. Until 2011, the increase in length is rather stagnant, the values remain at about the same level. Thereafter, however, the slope steepens. It is a generally continuously increasing trend with slightly higher increases commonly observed over spring/summer months
Atlas Mountains
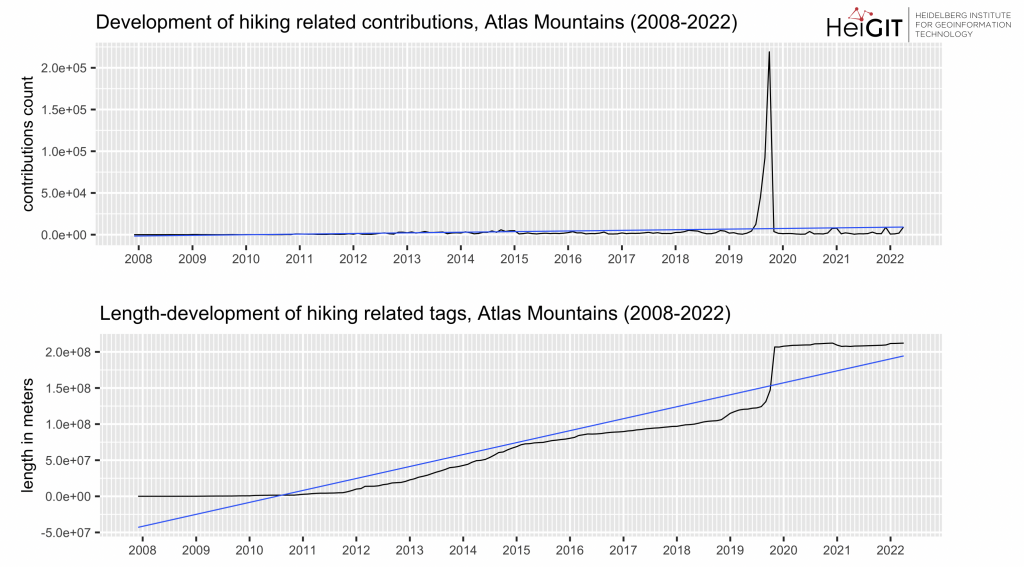
In the Atlas Mountains there is only low contribution activity with a slight increase towards the end of the graph (around 2020). However, there is an outstanding peak between July and November 2019, which is also reflected in the monthly length graph. Potentially, the cause could potentially be a larger import and it seems and it seems likely that at least the majority of the contributions here correspond to the contribution type creation.
Many of the smaller annual peaks occur mainly during the second half of the year, which can be seen especially well in 2009. The length plot also displays the peak of 2019, but beyond that a first, less intensive increase between November 2018 and February 2019 is already visible. In general, the values for the Atlas Mountains are rather lower and a truly notable increase in length is only observable 2012. Again, it is noticeable that the activity takes place mainly in the second half of the year, while in particular May to July represent months of rather low activity.
European Alps
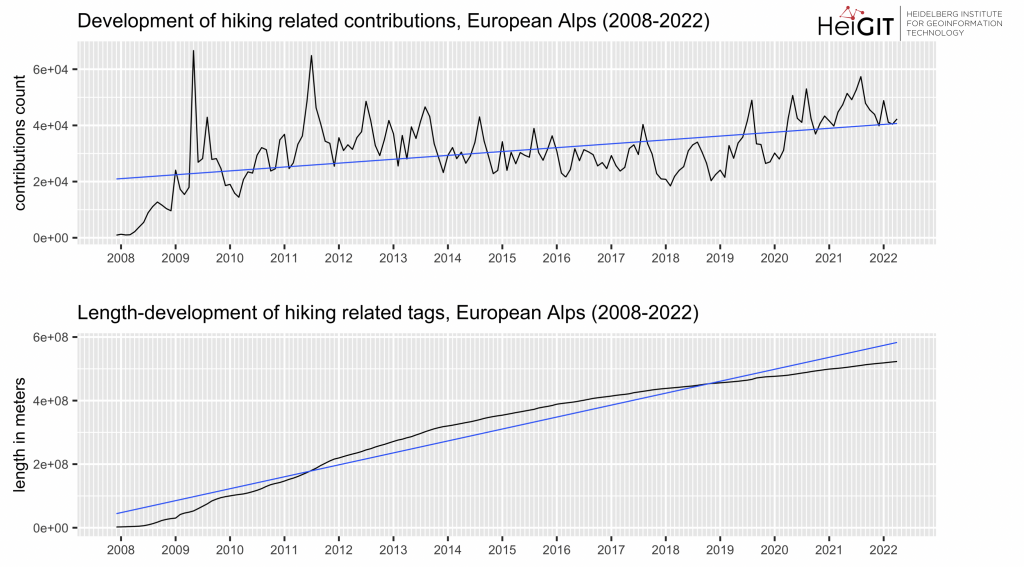
The contributions plot shows an increasing trend of general activity over the considered period. Starting from April 2020 onwards, we see higher values are visible, which coincides with the beginning of the measures against the pandemic coming into force around this time. Looking at the development per year, it can be seen that especially warmer months, such as April/May and July/August and additionally December/January, show an increased contribution activity. The latter could be related to winter tourism.
There are two distinct peaks, between May and August 2009, and between May and September 2011. Looking at the temporal evolution of hiking-related tags in their length, no particular seasonality emerges. The values increase continuously, with no months or seasons standing out in particular.
Himalaya
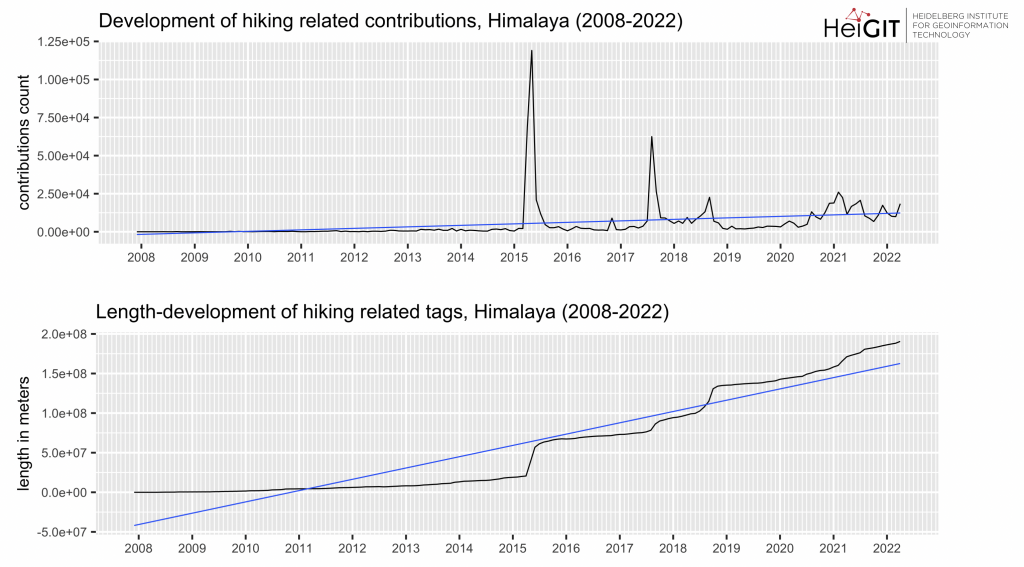
Contribution activity for the Himalayan Mountains increases over the period considered, with two peaks ibetween March – August 2015 and July – October 2017. Similar to much of the other regions, there has been an increase in activity since 2020, with no particular seasonality evident apart from several lighter increases between April and September. The peaks shown in the contributions graph for 2015 and 2017 are also visible in the length plot, but there is another larger jump in data between July and November 2018. The severe peak in 2015 is most likely related to the earthquake that took place around the time. The length does increase over the period, but in stages rather than continuously.
New Zealand Southern Alps
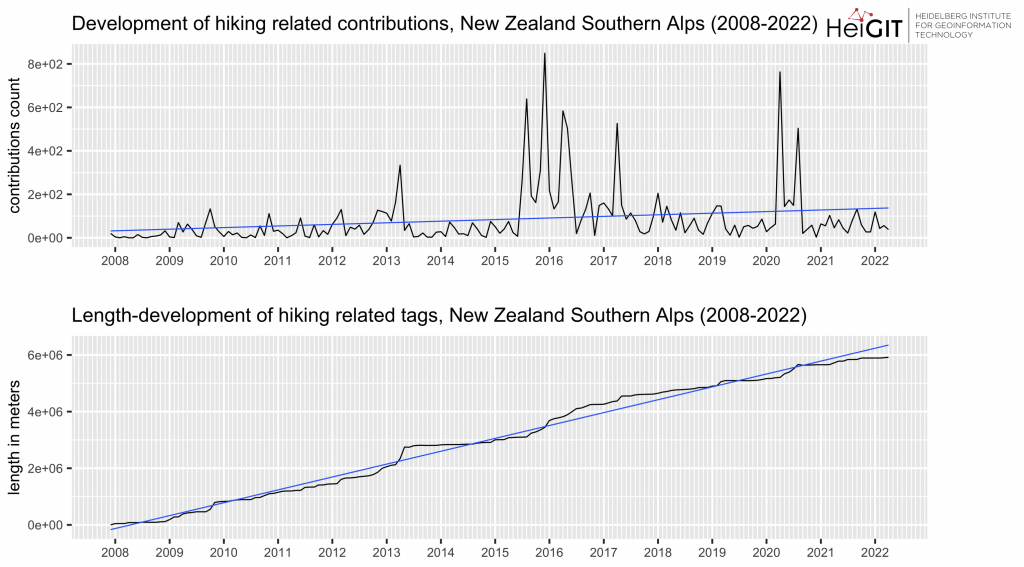
In the case of the New Zealand Southern Alps, prominent peaks occur in June 2015, June 2016, and March – May 2017, when the contribution activity appears particularly high. As before, activity rises from around April 2020. All peaks are followed by a sharp dip, so this is not a trend of generally increased activity. Also, the increased contributions that occur in 2020 subside again in the following year. Depending on the year, increased contribution activity is often found over December and January, i.e. over the summer. In addition, increased activity can also be seen in April or between September and October.
In the case of length, the linear trend and the exact monthly development are very close. In some cases, however, jumps can be seen, e.g. August to October 2009, March to May 2019 or April to August 2020, all of which can also be seen in the contributions plot. In these cases, it seems that there is indeed an explicit increase in tagging activity. Consistent jumps in a specific time of the year running through the time series are also not evident here. Lastly, the slight stagnation in length values starting in 2021 might be related to a finalization in hiking-related tags within the frame of LINZ imports.
That’s it for our ohsome regions of the month. Each of them shows a somewhat positive trend where both the general length and contribution activity are on the rise. In addition, many examples probably also reflect the effects of the pandemic, which could explain many instances of increased activity from the first half of 2020. In some cases, we may see seasonality effects, for example in the case of the European Alps.
Thank you for reading the second part of the hiking-related tags series. Stay tuned for more ohsome content!
Background info: the aim of the ohsome OpenStreetMap History Data Analytics Platform is to make OpenStreetMap’s full-history data more accessible for various kinds of OSM data analytics tasks, such as data quality analysis, on a regional, country-wide, or global scale. The ohsome API is one of its components, providing free and easy access to some of the functionalities of the ohsome platform via HTTP requests. Some intro resources can be found here: here:
- ohsome general idea
- ohsome general architecture
- how spatial joins queries work in the OpenStreetMap History Database OSHDB