At long last, welcome back to out Region of the Month-series, where we look at different regions in the world and how tags are used there. Today we would like to look at Covid-19 related OpenStreetMap tags in Germany, Austria and Switzerland. More specifically, we would like to look at test stations and vaccination centers and when they were tagged. If you are new to this series, we would love for you to take a look at our other Region of the month-blog posts, for example this one on the length of coastlines or this one on building information. Now, let’s look at what we can find out in this month’s analysis, shall we?
Data
As already mentioned, we chose to look at the countries Germany, Austria and Switzerland as one region. For this, we got our input boundary file here. For your convenience, we put all our input files as well as some example requests in a snippet which you can find here.
Requests
We sent several requests for this analysis, to get a good look at the character of the Covid-19 related tags. The used tags were healthcare:sample_collection, for the test stations, and vaccination=covid19, for the vaccination centers. Our requests to the ohsome API had the following filter conditions:
Test stations:
format=csv
filter=type:node and sample_collection=covid19
time=2020-01-01/2022-01-23/P1D
endpoint: /elements/count

filter=type:node and healthcare=sample_collection
time=2020-01-01,2022-01-23
endpoint: /elementsFullHistory/geometry
showMetadata=true
properties=tags
Vaccination centers:
format=csv
filter=type:node and vaccination=covid19
time=2020-01-01/2022-01-23/P1D
endpoint: /elements/count

filter=type:node and vaccination=*
time=2020-01-01,2022-01-23
showMetadata=true
properties=tags
endpoint: /elementsFullHistory/geometry
*Another request with type:way was sent for each /elements/count request, in case some of the objects might have been tagged as a different type. The type “relation” was left out as there were no tagged relations for test stations whatsoever and none for vaccination centers within the region of this analysis.
For each tag, different requests were sent (/elementsFullHistory/geometry and /elements/count), as we wanted to look at the count of the official recommended tags, as well as at which other ways to tag vaccination centers or test stations might have been in use.
Exploration
Test stations
Below you can see the sum of objects tagged with the recommended sample_collection=covid19 for test stations:
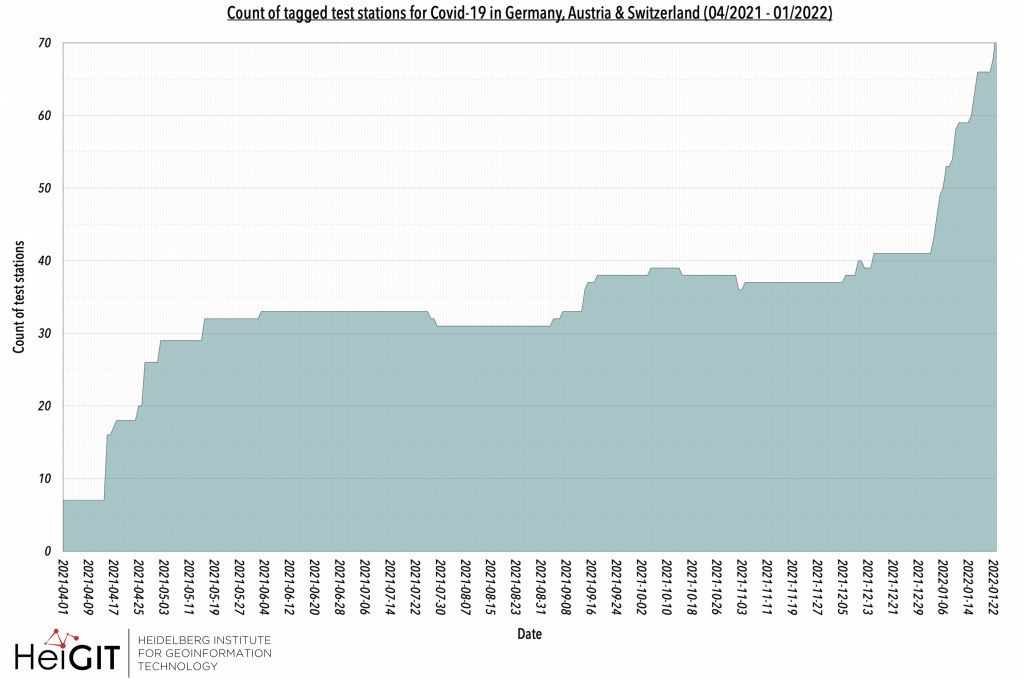
Test stations have only been tagged since April 2021, with a stronger increase during this month and values continued to rise well into May. Following this, the count values were always in a range between 30 and 40 objects with smaller changes until another increasing period set in starting in December 2021. Generally, there are rather low values of tagged objects compared to the actual number of test stations.
Below you can see maps with the recommended test station-tag sample_collection=covid19 as of 01/01/2021 (upper) and 01/01/2022 (lower):
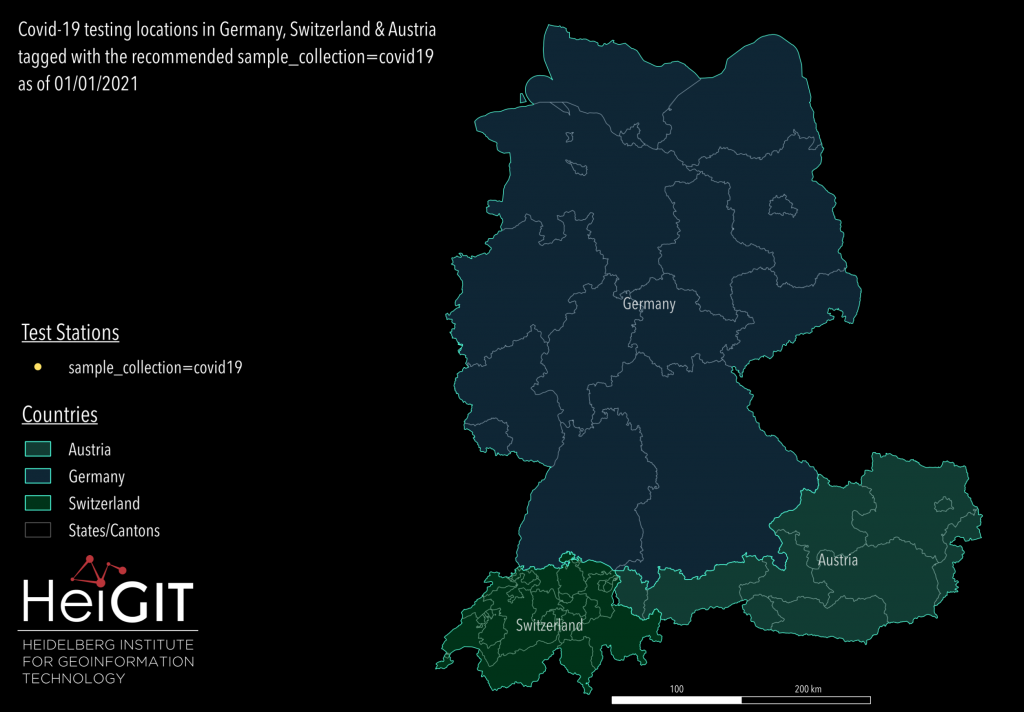
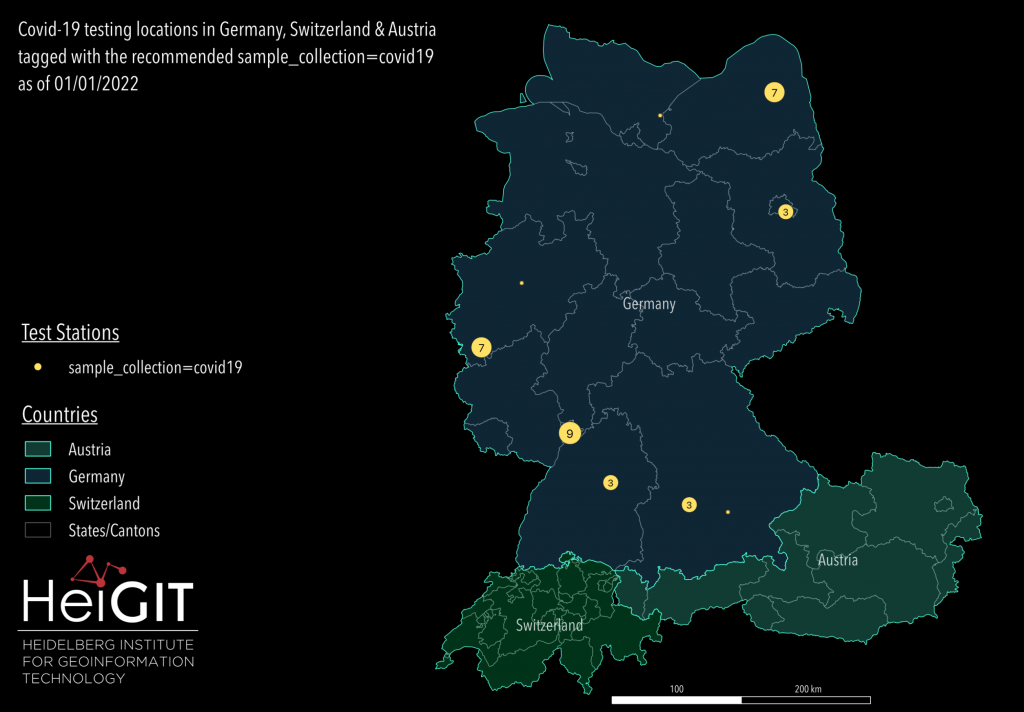
As mentioned earlier, the tagging of testing facilities begun much later in comparison to vaccination centers. Therefore, no objects are displayed in the map for the state on 01/01/2021. The reason for creating the map was to see whether tags other than the recommended sample_collection=covid19 might have been tagged earlier but this too, wasn’t the case.
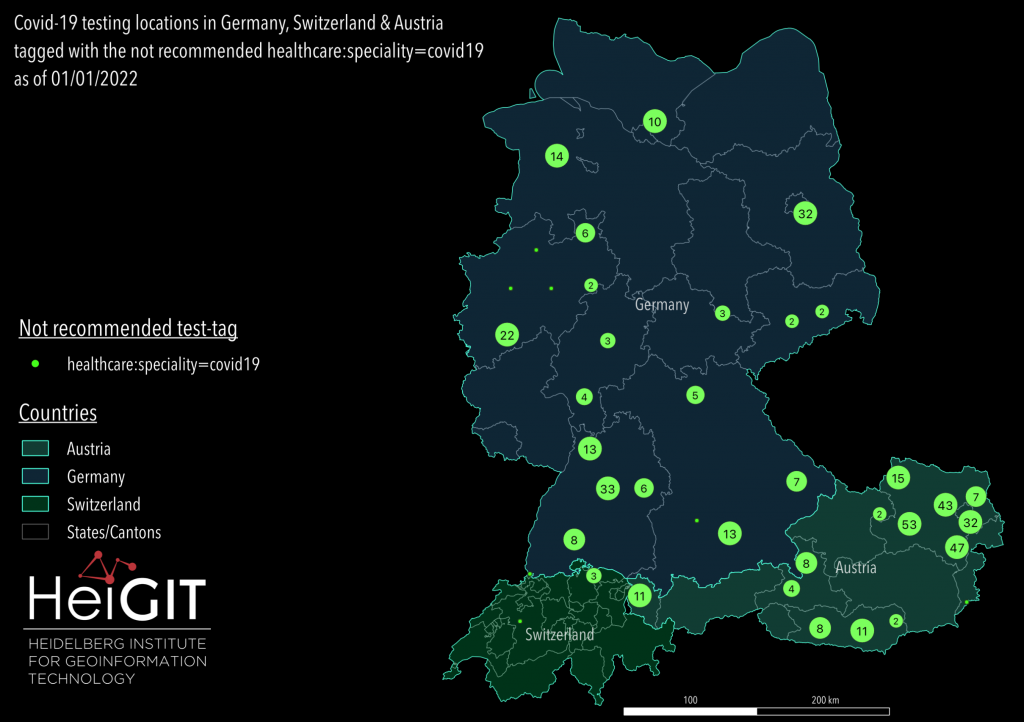
Furthermore, the recommended tag has hardly been used at all, even worldwide the count of objects is quite low and in Switzerland and Austria, no test stations whatsoever were recorded using this tag. However, when requesting all healthcare=sample_collection objects, the tag healthcare:speciality=covid19 is used particularly frequently, as can be seen in the map below, although this is not recommended. Please note: Since this tag is rather unspecific regarding the purpose of each tagged facility one cannot be sure about really dealing with a testing facility or something else. When taking a look at the map below, you can see where said tag was used.
Below you can see a map with the not recommended test station-tag healthcare:speciality=covid19 as of 01/01/2022:
Vaccination centers
Below you can see the sum of objects tagged with the recommended vaccination=covid19 for vaccination centers:
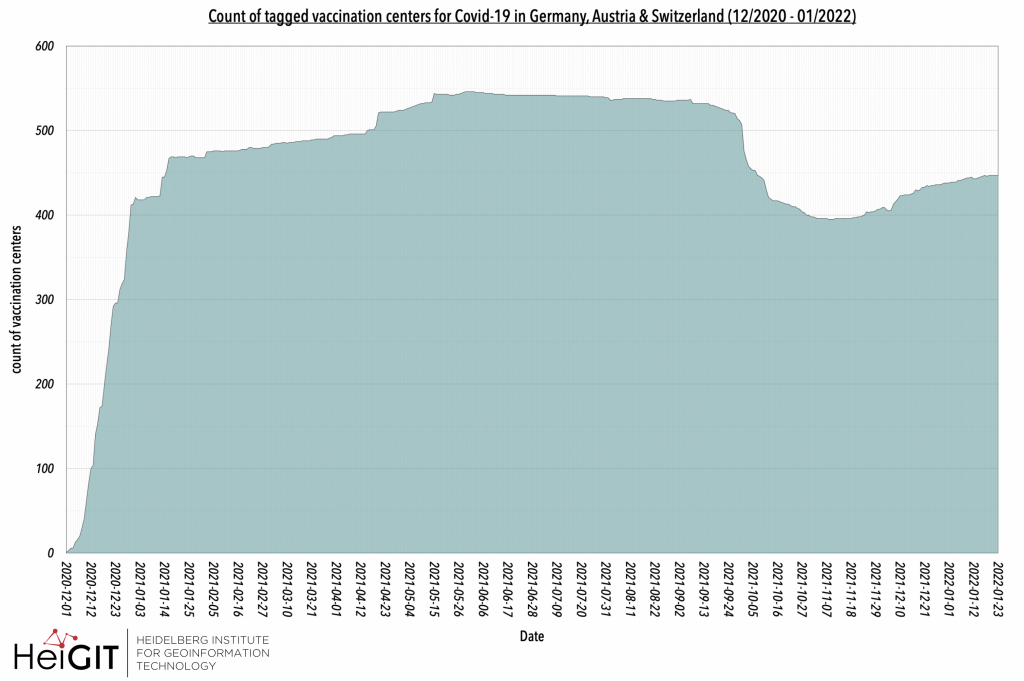
Since December 2020, vaccination centers have been tagged with an enormous increase from 0 – 413 objects during that very first month. The values have risen up to almost 550 by the end of September 2021, followed by quite a sharp drop back to approximately 400 objects. Around the end of November, a slight increase set in again and the count went up to almost 450 properties by the end of the period under review. Although one could come to the conclusion, that the number of vaccination centers might have dropped more significantly with time when taking the information of the tag opening_hours!=closed into account (so having that additional tag in the filter-options of the request shown earlier in the blog post), however this appears not to be the case as the values of both requests are mostly the same.
Below you can see maps with the recommended vaccination=covid19 tag as of 01/01/2021 (upper) and 01/01/2022 (lower):
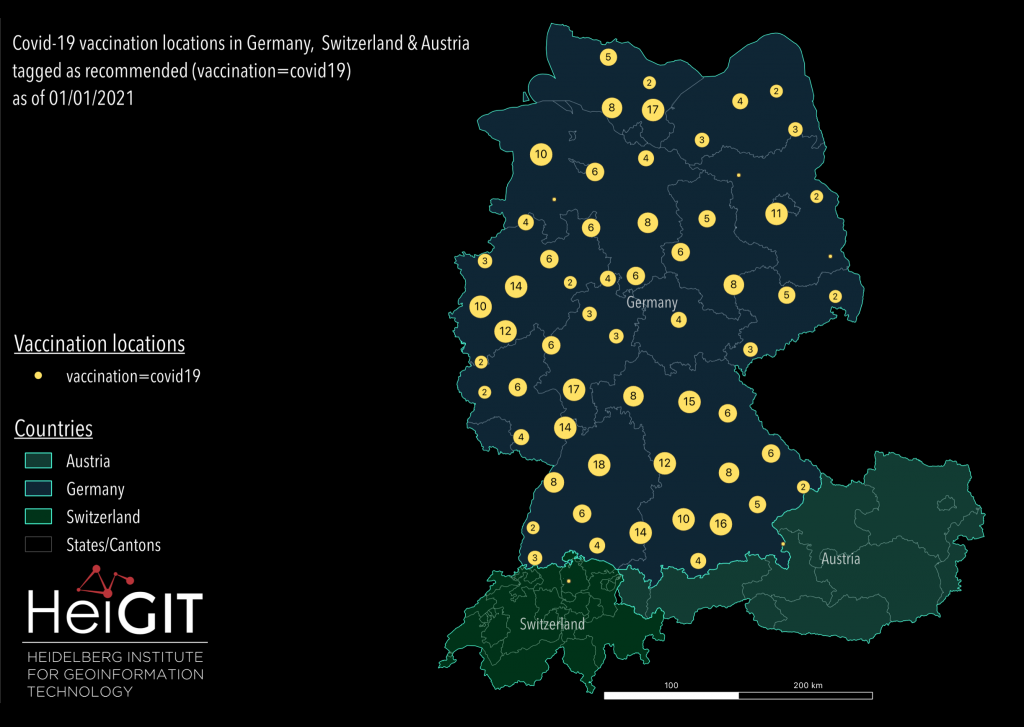
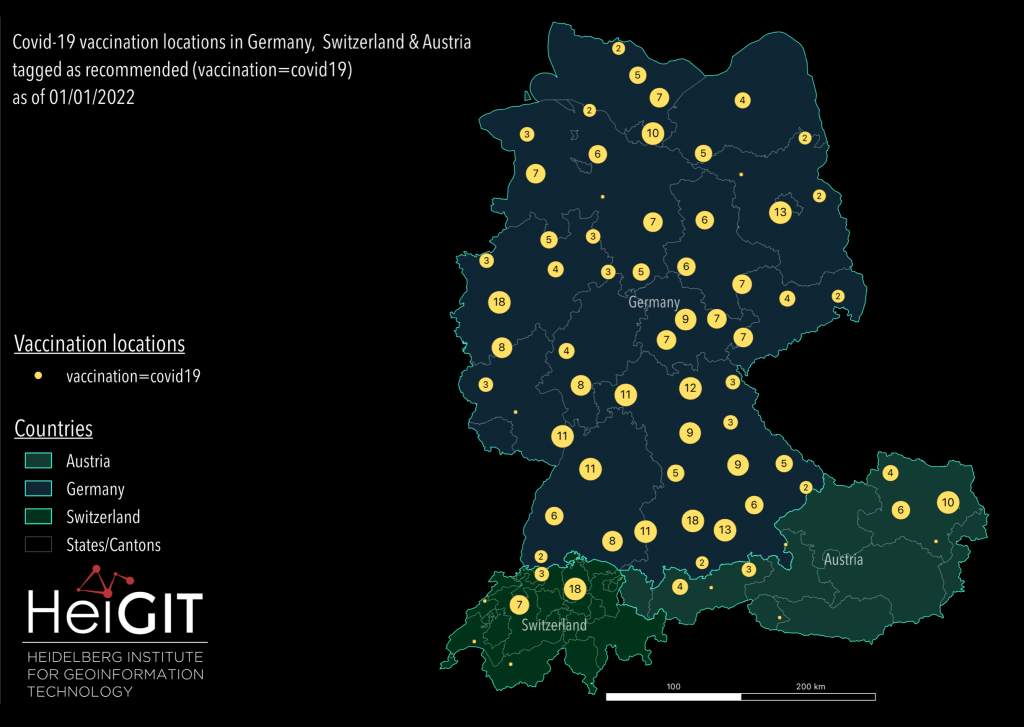
Austria and Switzerland only show the recommended tags, while there appears to be a variety of ways to tag covid vaccination centers within Germany. All those tags are not added in the maps and listed below*. However, it should be noted that the non-recommended tags only make up seven objects in total, as can be seen in a graphic in the snippet which was made for comparison. Furthermore, as of 01/01/2021, virtually no vaccination facilities in Switzerland or Austria have been tagged, but this has changed by 01/01/2022 when there were noticeably more vaccination centers displayed.
*not recommended tags:
vaccination=Covid 19
vaccination=covid-19
vaccination=COVID-19
vaccination=Covid19
vaccination=SARS-CoV-2
In conclusion, there are very little test stations tagged in OpenStreetMap compared to the real number of testing options. This however is especially true for the recommended tag, whilst another one (healthcare:speciality=covid19) appears to be used more frequently. Vaccination centers were tagged more often and sooner as well. Only very few objects do not follow the recommended tagging scheme whilst the recommended tag appears to be well established throughout the regarded countries.
Thanks for reading this month’s ohsome blog post, we hope you liked it! Stay tuned for more!
Background info: the aim of the ohsome OpenStreetMap History Data Analytics Platform is to make OpenStreetMap’s full-history data more easily accessible for various kinds of OSM data analytics tasks, such as data quality analysis, on a regional, country-wide, or global scale. The ohsome API is one of its components, providing free and easy access to some of the functionalities of the ohsome platform via HTTP requests. Some intro can be found here:
- ohsome general idea
- ohsome general architecture
- how spatial joins queries work in the OpenStreetMap History Database OSHDB

