In this space, we have uploaded our two posters and their contents for this week’s UN Map Conference in Valencia, Spain on March 6-10, 2023. Our poster highlights three major case studies from HeiGIT and GIScience with applications for researchers, NGOs, IGOs, government agencies, and emergency responders. Check back for updates and more information as the poster session draws near!
Poster:
Poster_UN_Map_Conference_HeiGIT_neuPoster_UN_Map_Conference_Projects_final
Text for HeiGIT and GIScience Case Studies Poster:
Case Study: Accessibility Analysis for SDG Monitoring with OSM Data
Increasingly, stakeholders are exploring the use of geospatial data from OpenStreetMap (OSM) to monitor progress towards Sustainable Development Goals (SDGs).
For example, accurate information on the coverage and capacity of healthcare infrastructure is essential to address health challenges posed by pressures such as the double burden of diseases, climate change, and pandemics.
Conventional methods to assess coverage and service gaps and capacity either ignore the composition of space (euclidean distance) or are too strongly aggregated (raster). Significant computing resources remain a barrier to maintaining detailed mobility models based on precise network information.
Our accessibility analysis uses the capabilities of OSM by integrating the fast and precise isochrones of openrouteservice (ORS) with open data from WorldPop.
ORS offers a sophisticated mobility model based on more than 10 years of research. Users can get up-to-the-minute information on how many people are within reach of a hospital or other healthcare facility.
Due to the progressing development of OSM data, the results and thus the value of the analysis are continuously improving. With the open data model of OSM, applications extend outside healthcare to other use cases.
Our solution can address many sustainable development goals including SDG 6 (e.g. access to safely-managed drinking water services), SDG 9 (e.g. rural all-season road access) and SDG 11 (e.g. access to public transport)
Example: Sub-Saharan Healthcare Access
The Open Healthcare Access Map shows that ~50% of people in the subcontinent live within a 60-minute drive of any healthcare facility. 10% of older adults need over 6 hours to reach the nearest hospital.
Our high-resolution maps can be used by policymakers and NGOs to help target additional healthcare resources such as makeshift hospitals or to transport programs to existing facilities.
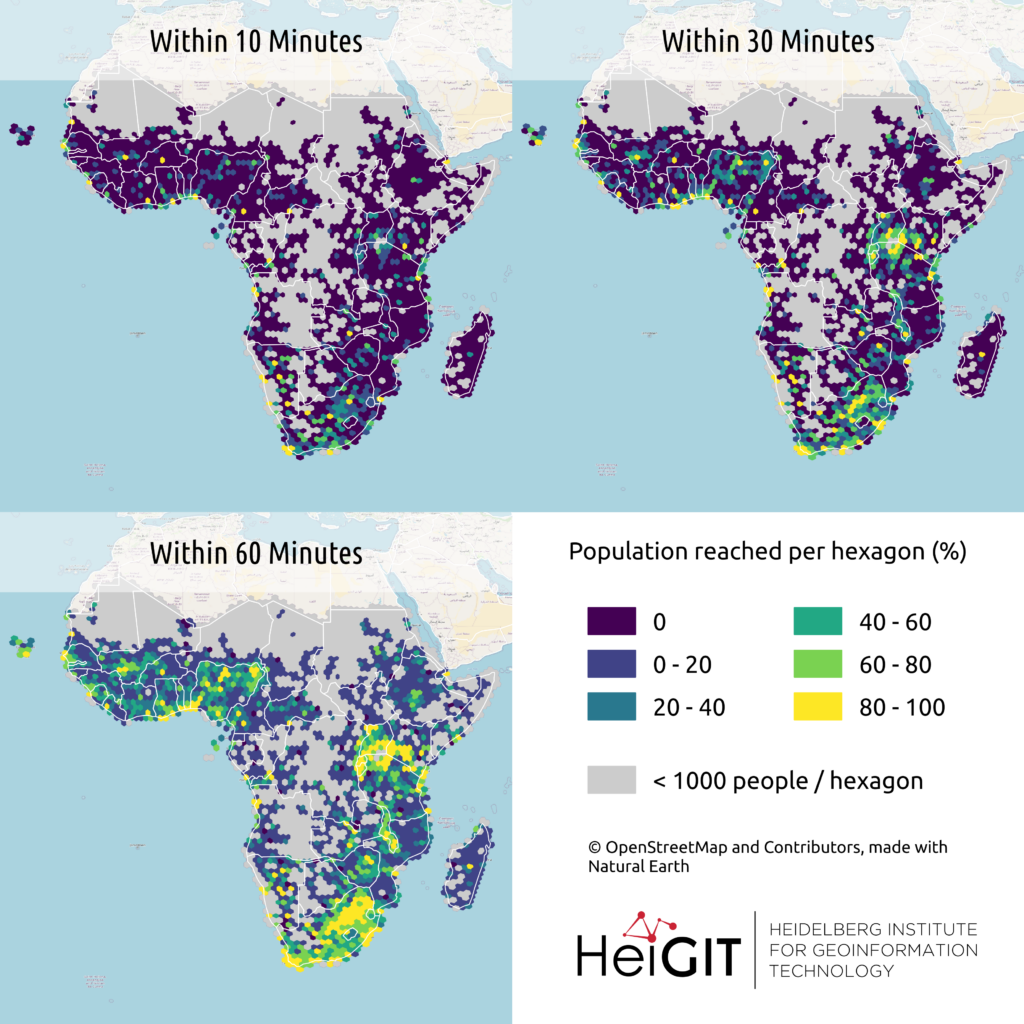
Figure 1: Hexagon aggregation of population covered for 10-, 30- and 60-minute driving distance to the closest healthcare facility.
Case Study: OSM Data Quality Assessment for Humanitarian Purposes
Humanitarian and intergovernmental organizations rely on high-quality OSM data in their missions, but usually do not analyze whether the data they use are (still) good enough. Underrepresentation of sparsely-mapped areas can lead to a spatial bias in research and analysis. In the words of HOTOSM, „Gaps in data create gaps in humanitarian response.“
There are at least three important quality dimensions in regard to “fitness for purpose”: Are the data correct (accuracy), are all necessary data available (completeness), and are the data up-to-date?
By combining OSM data quality analysis with socio-demographic characteristics of the areas of interest, researchers and stakeholders can account for the existing biases in OSM. The ohsome framework helps to achieve this with services including:
ohsome quality analyst (OQT) shows if OSM data are good enough for a specific use case within a certain area of interest,
ohsomeHeX helps to assess mapping progress, user activity and data development, and
ohsomeNow charts the real-time changes happening in OSM, customizable to your needs.
Example: OSM Data Quality Research
Our results reveal that for 1,848 cities, OSM building footprint data exceeded 80% completeness. In total, these cities were home to a population of 492 million people (16% of the global urban population).
On the other hand, our results show that for 9,163 cities, OSM building footprint data did not reach 20% completeness.
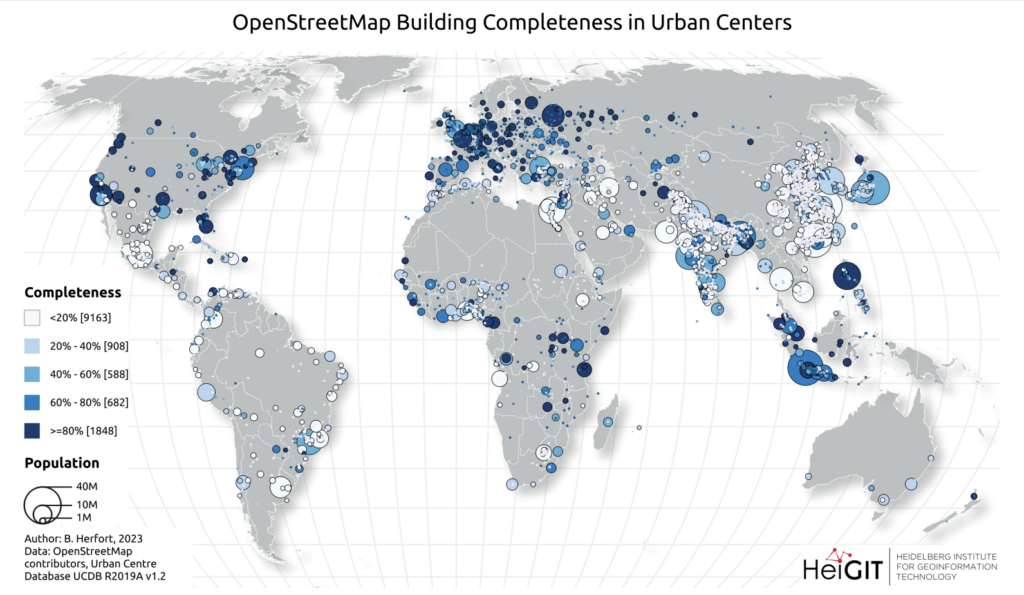
Figure 2: OpenStreetMap building completeness in 13,189 urban centers as of 2023-01-01.
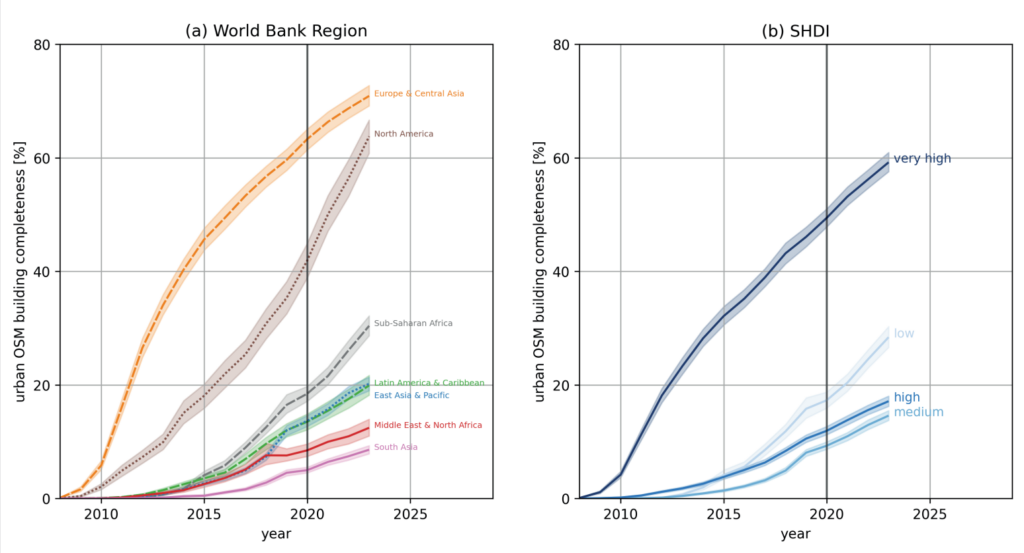
Figure 3: Temporal evolution of average urban OpenStreetMap building completeness by (a) World Bank regions and (b) Subnational Human Development Index (SHDI).
Case Study: Up-to-Date Routing for Emergency Responders
To deploy resources and plan routing and accessibility, responders need to know which roadways are accessible, especially in rapidly-changing situations like floods and earthquakes.
The recent earthquakes in Türkiye and Syria as well as recent events like the floods in Pakistan have presented opportunities to use routing technologies to support more efficient aid efforts, especially in the Global South.
Combing OSM contributions with data from local agencies is our best avenue for sharing up-to-date road network information, e.g. on road closures.
The HeiGIT Disaster Portal uses the directions and isochrones functionality of the ORS and provides a store to persist disaster areas.
During typhoons in the Philippines and floods in Germany, our routing solutions have been used for logistical decisions, to calculate optimal routes for the distribution of humanitarian aid, and to locate available infrastructure in affected areas.
Support for your custom data layers and improvements for scenario-dependent routing are forthcoming.
Example: Disaster Portal in Türkiye
The HeiGIT Disaster Portal allows you to calculate car routing for the regions affected by the 2023 Türkiye/Syria Earthquake. The underlying OSM data is updated every 10 minutes.
Users can create routes between addresses, Point of Interest (POI) names, coordinates and locations selected directly on the map or through an API. The routing also considers „avoid areas“, e.g. closed border points and flooded regions.
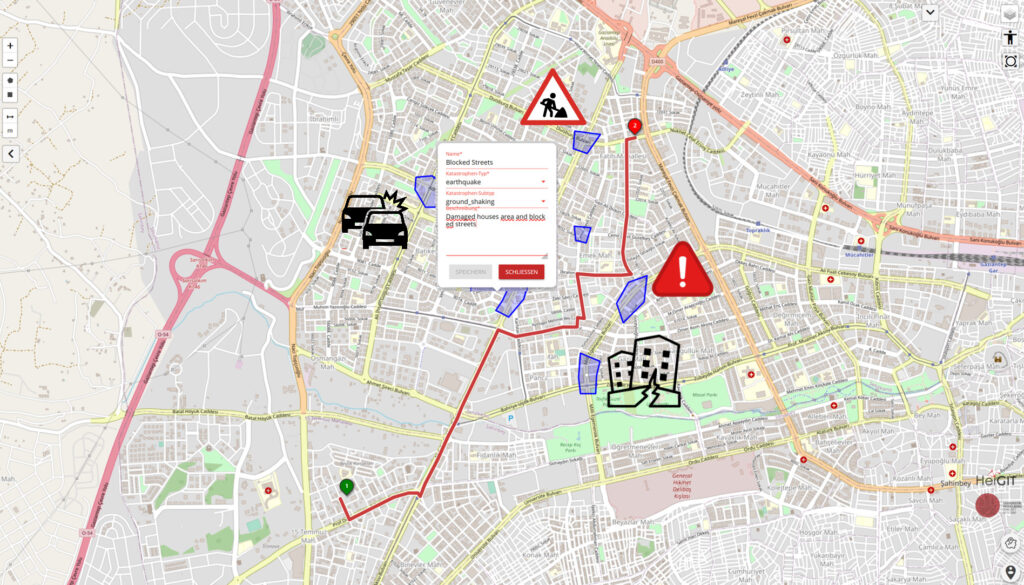
Figure 4: Example route created with the disaster openrouteservice taking damaged infrastructure into account. Base data from OpenStreetMap.
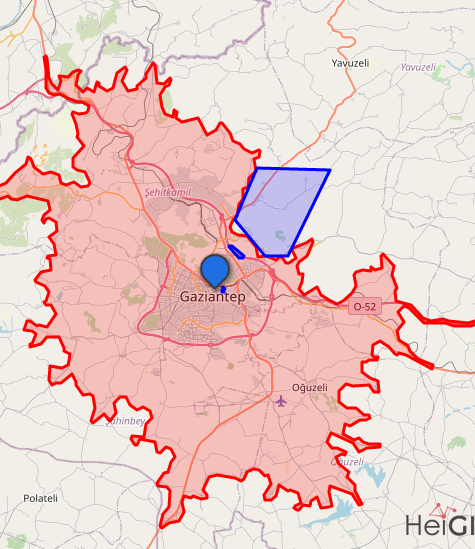
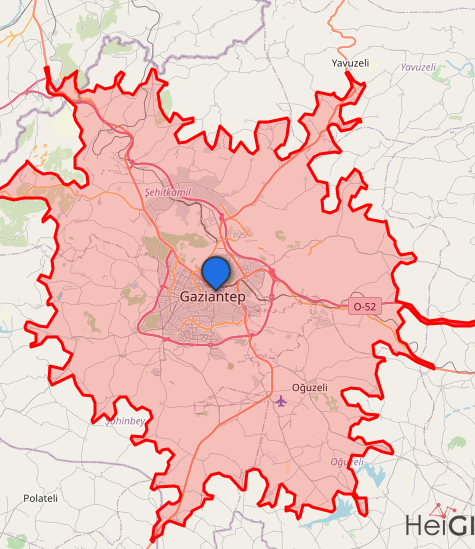
Figure 5: Left: Isochrone that is not affected by avoid area. Right: Isochrone affected by avoid areas. The avoid area in the northeast reduces the potential reachable space there and beyond. Base data from OpenStreetMap.
The objective of HeiGIT and GIScience Research Group at Heidelberg University is to improve knowledge and technology transfer from fundamental research in geoinformatics to practical applications.
Find us on: Twitter (@GIScienceHD) | Mapstodon (@heigit@mapstodon.space) | LinkedIn (HeiGIT) | HeiGIT-Website (heigit.org) | GIScience-Website (geog.uni-heidelberg.de/gis/)