We work with large open geodatasets, with a focus on OpenStreetMap (OSM). Our software calculates quality indicators, so users can check whether OSM data is fit for their purpose before they build on it. We also enrich OSM with attributes derived from satellite and street-level imagery using spatial data mining and deep learning, and we publish the results as analysis-ready datasets. Methods and quality standards are developed together with public authorities, international organizations, and research institutions, and the work is oriented toward humanitarian response and climate action.
Tools to measure completeness, correctness, and thematic accuracy of OpenStreetMap (OSM) data globally and in near real-time.
Enriched OSM data in analysis-ready formats, tailored for data scientists.
Collaborations with public sector, international organizations & research institutions.
OpenStreetMap is a vast source for user generated free geodata for various use cases. However, due to the lack of standardized data generation methods and varying quality requirements, users may face challenges. We address this by developing software and services with which OSM data quality indicators can be calculated globally or for specific areas, helping users assess whether the data meets their project needs.
The ohsome dashboard makes the full history of OSM data accessible without programming skills. Users can filter and group statistics by tags and types for any region and time period, and follow how mapping in an area has developed over time.
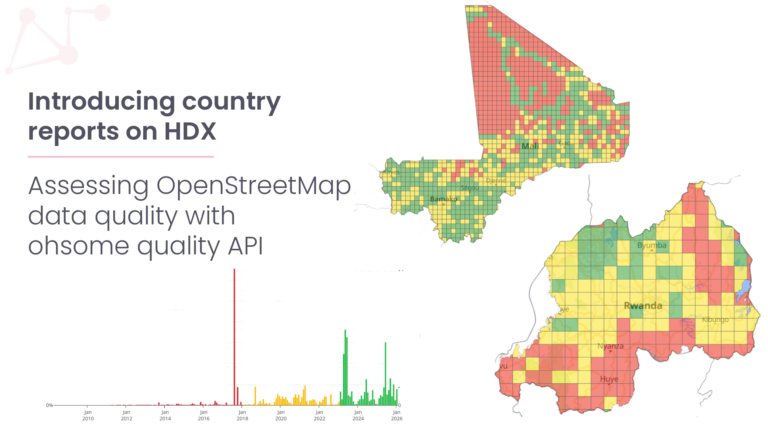
The ohsome quality API (OQAPI) provides quality information on OSM data for a specific region and use case, allowing to assess how far humanitarian organizations or public administrations can rely on OSM data for a given task.
Beyond software development, we focus on enriching OSM datasets that are stored in a data lake accessible to users. Due to OSM’s crowdsourced nature, the data often varies in quality, posing challenges for researchers, especially those working with large datasets.
We use these technologies to add missing attributes, making the data ready-for-use.
We provide collaboration partners with data that’s formatted, and enriched with attributes, depending on the project’s needs.
Access to high-quality datasets reduces preparation time and increases the accuracy of machine learning models.
The first Road Surface Type offers a global dataset with 2.2 billion images from Mapillary and OSM data, categorizing roads as either paved or unpaved. The second one, provides satellite-based road surface dataset derived from high-resolution imagery (PlanetScope, 2020–2024), covering about 9.2 million kilometres of major transport routes, including surface type classification, road width, and a “Humanitarian Passability Score”. These datasets support applications in economic development, environmental sustainability, route planning, and emergency response.
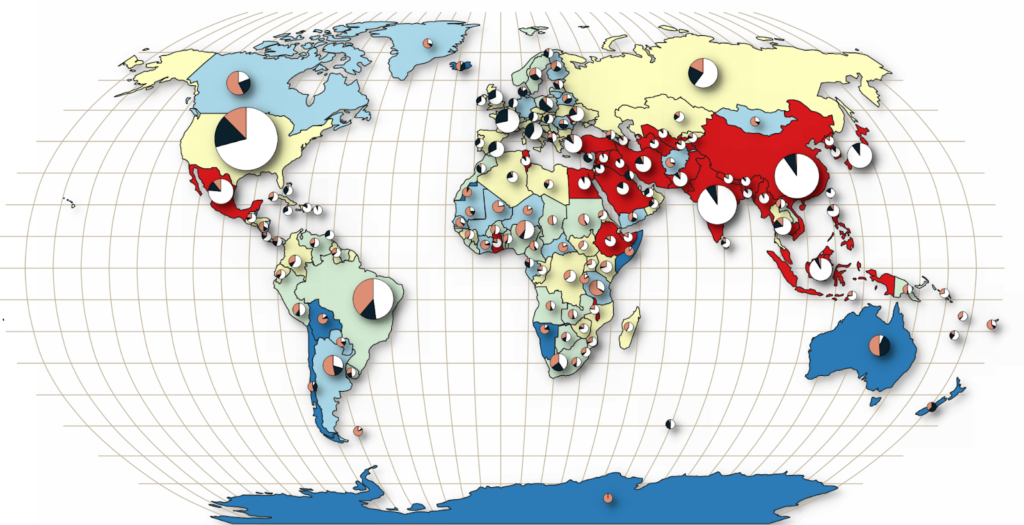
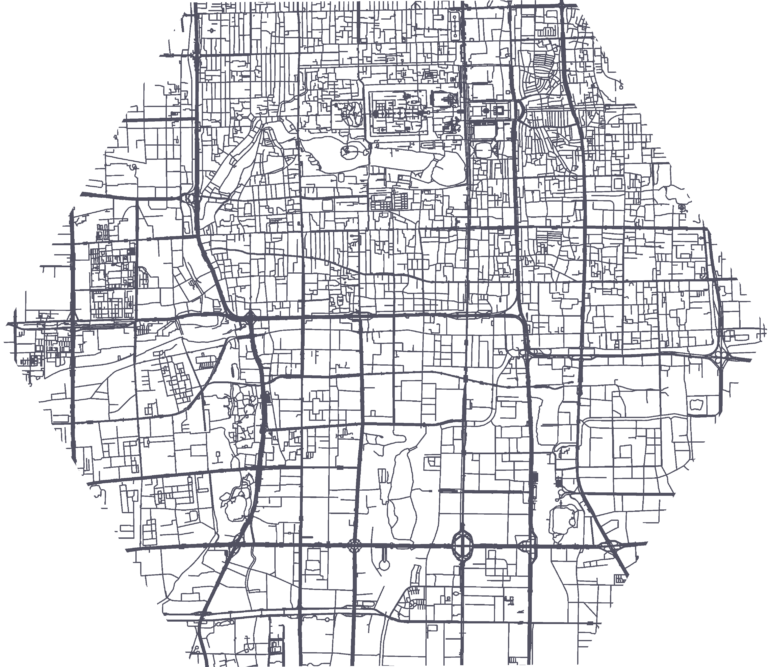
The OSM Land Use Land Cover Map web application offers a view of land use patterns globally, utilizing OSM data. This service visualizes land use classifications by integrating detailed maps with various land use categories, such as residential, commercial, and industrial areas for a single point in time. The application allows zooming for detailed views, making it a valuable tool for analyzing land use dynamics.
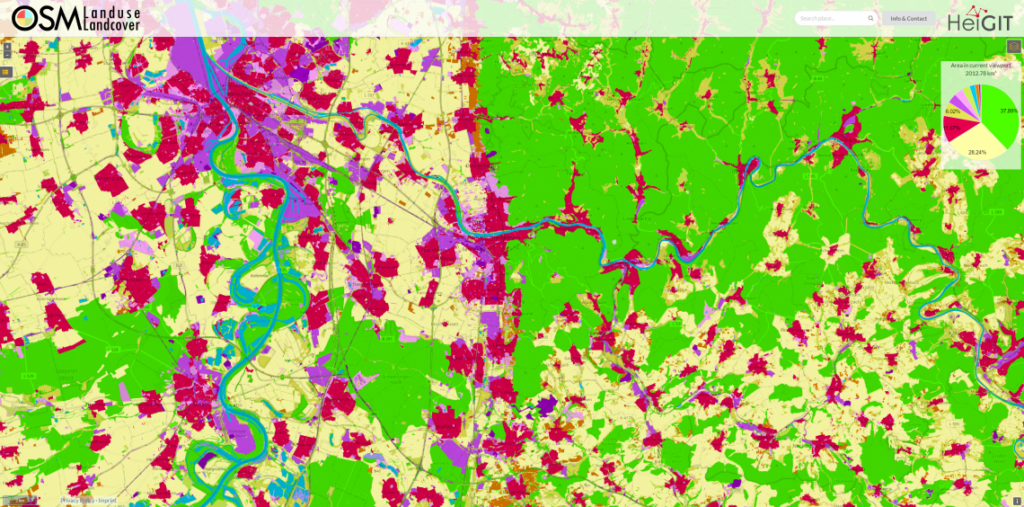
Our services and software help users analyze OSM data and its changes over time. They are primarily used by the OSM community, humanitarian organizations, and researchers seeking to gain insights from evolving geospatial data.
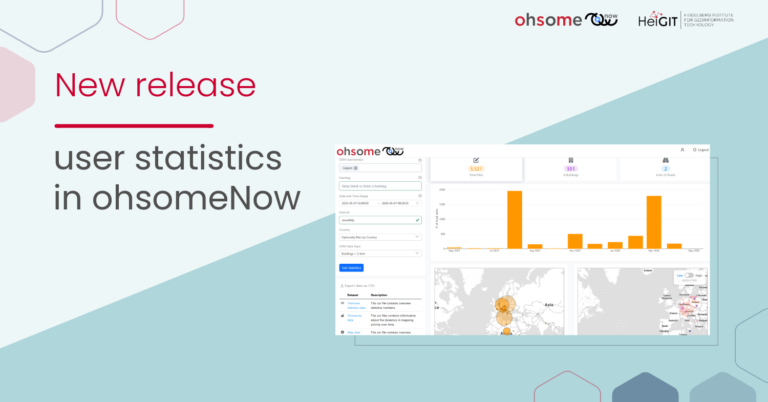
The ohsomeNow Stats dashboard provides near real-time, global statistics on OSM mapping activity, including metrics like contributor count, map edits, added buildings, and road length. Data is updated in real time, with users able to filter by OSM Changeset hashtags and access statistics from April 21, 2009. This tool was developed in collaboration with the Humanitarian OpenStreetMap Team (HOT).
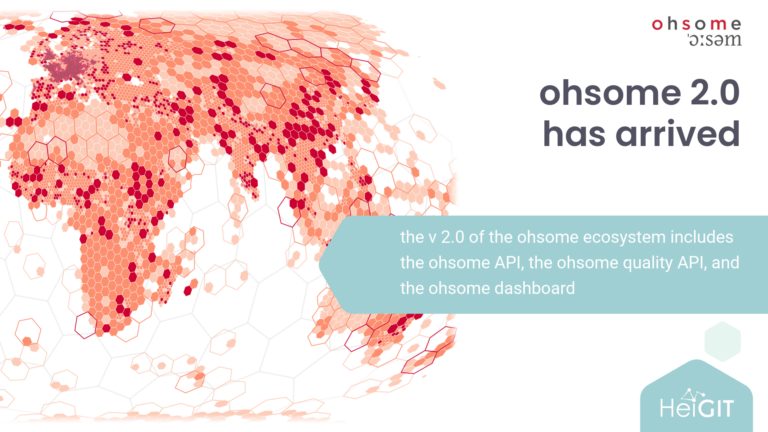
Last year, we published our initial roadmap toward ohsome 2.0,…