The #ohsome quality analyst (short: OQT) has been online and accessible through its web-interface now for quite some weeks already (see the introductory blog post as a reference). The website is not the only access point to the OQT though. Therefore, the ohsome team at HeiGIT would like to give some insights to the additional components of the OQT.
Components
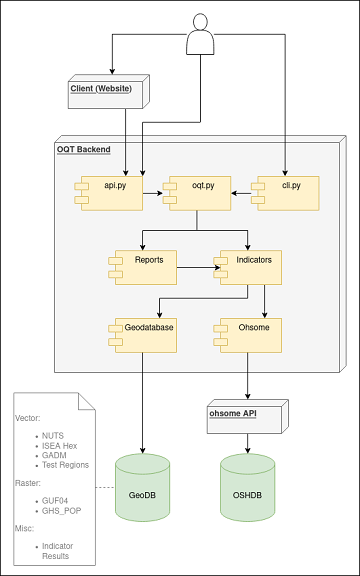
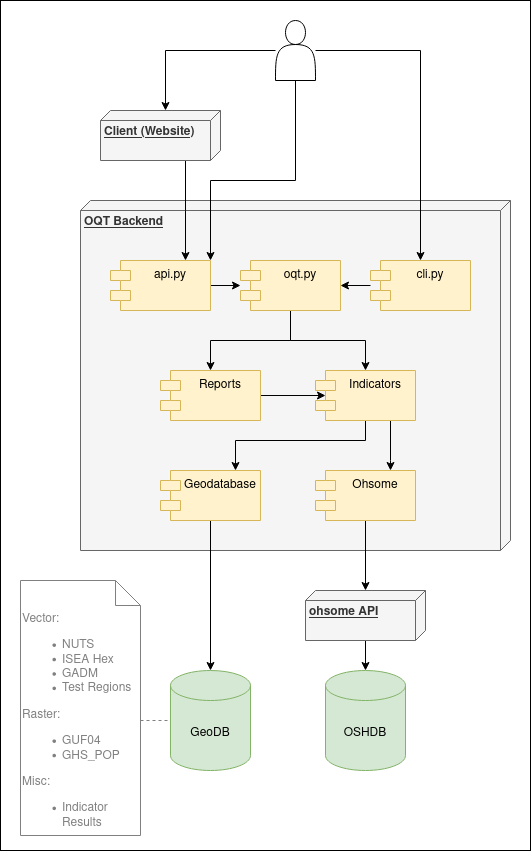
The OQT has a layered structure: the client-side consisting of a website and the backend-side consisting of different python modules, together with a PostgreSQL GeoDB. To illustrate the components of the OQT we have created the following component diagram. Within the next sections, we will explain the different parts individually.
Application Programming Interface (API)
The first backend entry point, in addition to the end-user oriented website, is through a simple API using one of the various endpoints. The OQT uses the Fast-API python framework and provides at the moment a total of eight endpoints. All endpoints can be accessed via GET and POST requests, though when submitting bigger area of interests, it is recommended to use the POST endpoint. Through the API, the user can request the individual indicators, or reports directly and use the returned JSON file for further processing.
Command Line Interface (CLI)
The second backend access to the OQT functions via a command line interface. Here, the user has the biggest set of different functions and commands available. Some of them are only available though to core developers of the OQT. This includes starting preprocessing jobs for respective indicators and regions that are then stored in the GeoDB. Nevertheless, the CLI is useful for an end-user who is not interested in the processing overhead of the website or the API. Further, it serves as a simple way to test newly developed or integrated indicators.
Data Backend
The GeoDB and the OSHDB serve as the data providers to perform the quality analysis. The OSHDB, a well established database storing the historical OpenStreetMap data to make it easier retrievable and analyzable, is accessed through the RESTful webservice ohsome API. The OQT uses different kinds of endpoints, from data-extraction endpoints like /contributions to compute the saturation indicator, to data-aggregation endpoints like /elements/count for the ghs-pop building completeness, or the POI density indicators.
The GeoDB has two purposes: The first one is to store datasets like the Global Human Settlement Layer, or the Global Urban Footprint to compare it with the OSM data. The second purpose is to store pre-computed indicators and reports. As some indicators require a longer processing time, especially if the area of interest spans over country level, or densely populated areas are analyzed, there’s also the functionality of getting a pre-computed quality analysis. This results in an immediate response to the user when requesting quality indicators within specific regions. These can then easily be retrieved through the OQT website.
Next Steps
Together with other ongoing GIScience/HeiGIT projects like IDEAL-VGI, or the Global Exposure Data for Risk Assessment, the number of quality indicators and reports within the OQT will further increase within the upcoming minor releases, which we plan to publish roughly every 4-5 weeks. As the OQT is a relatively new project, the code base is so far only internally accessible. We are already making plans though to follow other GIScience and HeiGIT repositories and will go public this spring. In case you are very eager to get to know the OQT from its inside already, you can always reach out to us via ohsome(at)heigit(dot)org and we would be happy to communicate with you.


