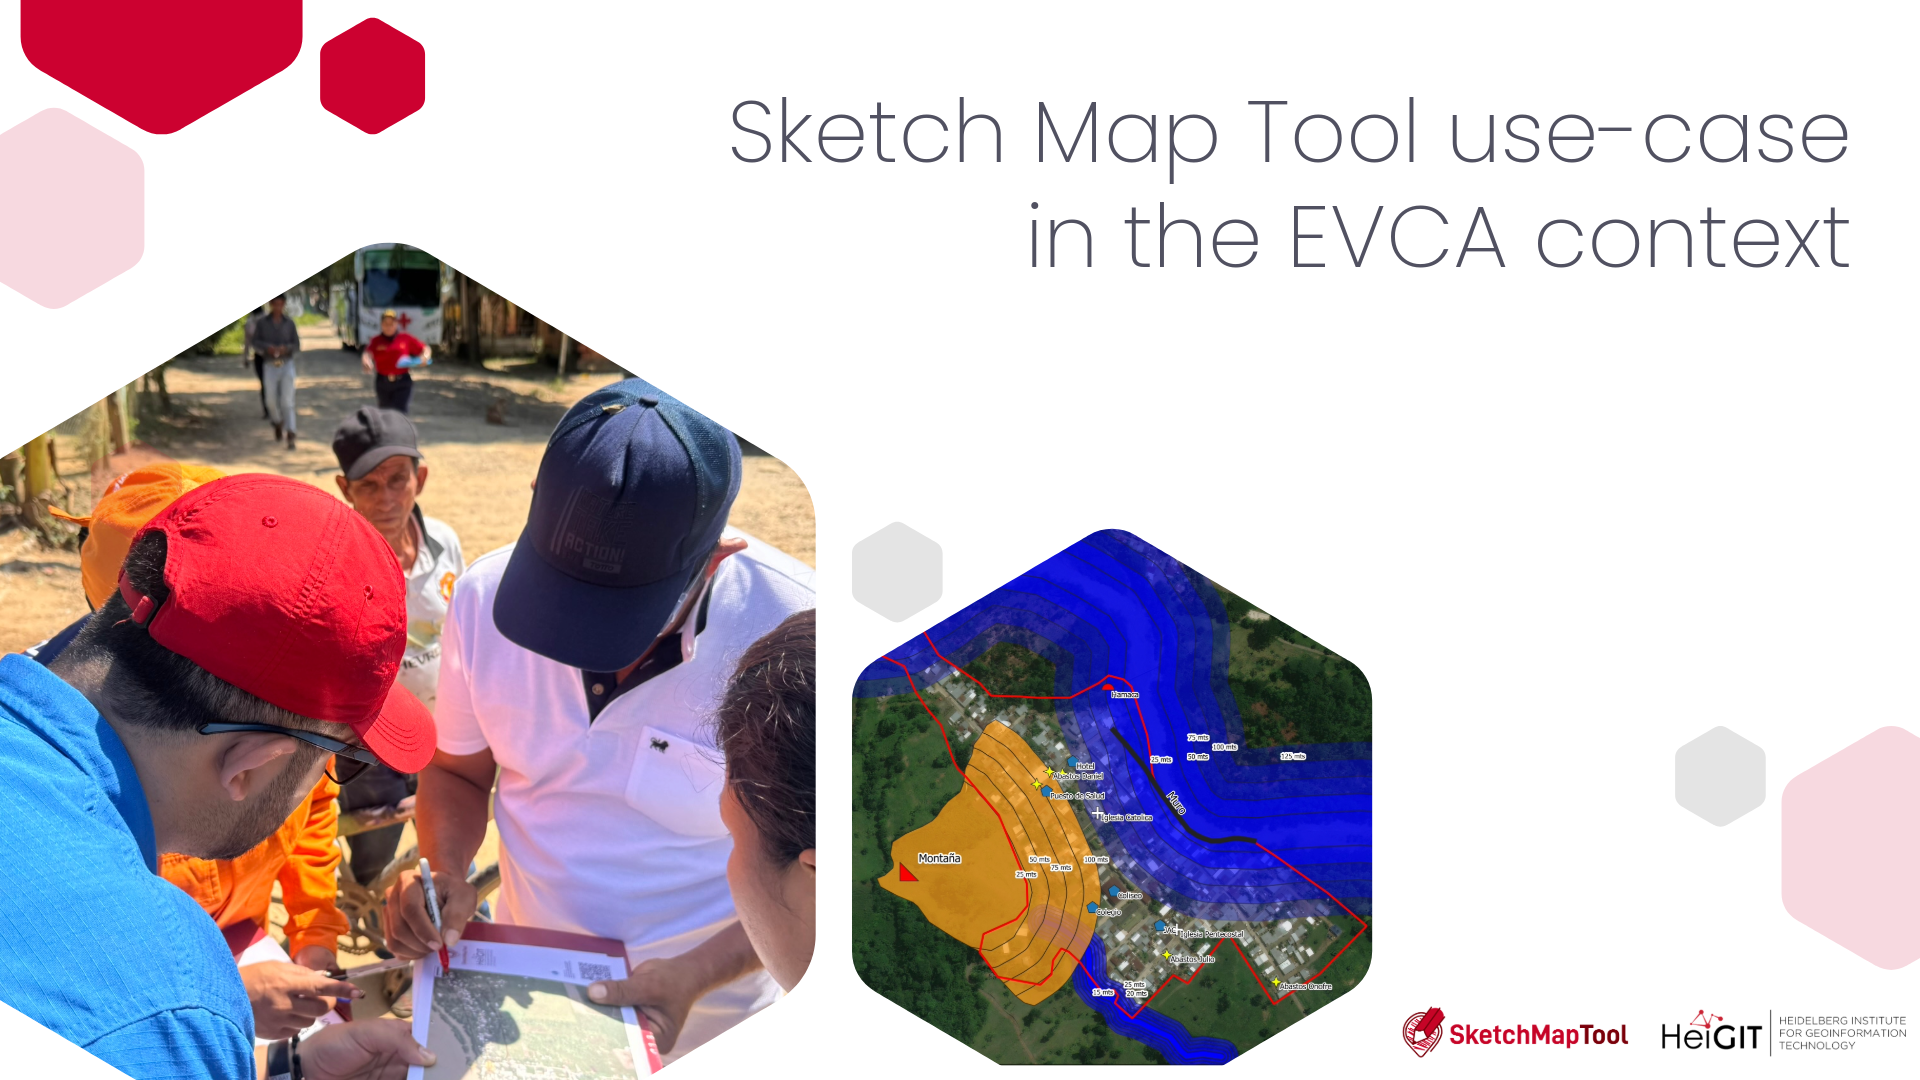
The Colombian Red Cross’s Disaster Risk Management (DRM) team works to mitigate the impact of emergencies and enhance community resilience throughout the country. Coordinating actions at both national and regional levels, the team focuses on the core pillars of risk knowledge, risk reduction, disaster management and climate change. The team’s primary commitment is to save lives and support the most vulnerable communities, which it achieves as the only private, nonprofit institution embedded within the National Disaster Risk Management System, serving in a supporting role to public authorities alongside other humanitarian actors.
Background
In 2023, the Colombian Red Cross (CRC), in partnership with the German Red Cross (GRC) and HeiGIT, initiated a project aiming to explore the usage of the Sketch Map Tool (SMT) in the context of the Enhanced Vulnerability and Capacity Assessment (EVCA). The SMT is a paper-based mapping tool that allows communities to collect geographic data offline and digitize it automatically for risk analysis; to learn more about its framework and advantages, you can visit the [Sketch Map Tool Guide]. The local team received training sessions on the use of SMT and GIS, along with support to implement the methodology in a pilot project in the community of La Capilla, Soacha. Over the past two years, the DRM Team from CRC has independently continued to implement the Sketch Map Tool in their workflows for conducting EVCAs within the framework of the ongoing project.
The Project
The project “Provisión de asistencia humanitaria a poblaciones vulnerables afectadas en Colombia” (Providing humanitarian assistance to vulnerable and affected populations in Colombia) funded by the European Union and GRC and implemented by the CRC, seeks to respond to the needs of communities exposed to recurrent emergencies. Adopting a preventive and participatory approach, the project strengthens local capacities through initiatives such as the formation and training of Community Emergency Response Teams (CERT) and the promotion of community organization via community disaster risk management plans. As part of the resilience assessment, community mapping was conducted using the Sketch Map Tool in three communities over two years: Pacelli (Tibú, Norte de Santander), Monserrate (Arauca) and Cubís (Istmina, Chocó).
Why was the Sketch Map Tool used?
The Sketch Map Tool was chosen basedonpromising prior experiences with the tool and because it automates the digitization and georeferencing of the paper maps drawn by the community. This automation saves a significant amount of manual work that is prone to errors and time compared to traditional digitization, allowing the team to rapidly analyze territorial information to identify critical areas, local resources and institutional capacities. Since the team was not always present during data collection, it was essential to build the capacity to collect data with the Sketch Maps among the local Red Cross volunteers, enabling staff in Bogotá to digitize and analyze the material remotely.
How was the Sketch Mapping organized?
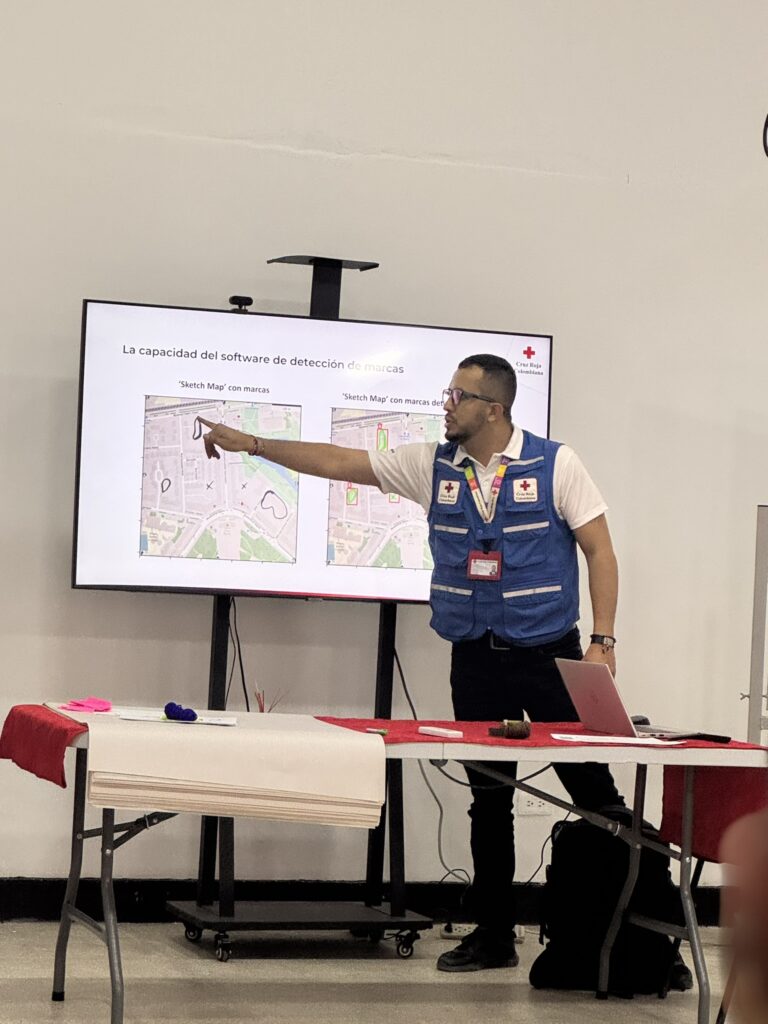
The three application cases were implemented sequentially, allowing for an iterative implementation process and a clear learning trajectory. This progressive refinement of the methodology led to substantial improvements in both the implementation of the tool and the quality of its outputs is fromthe first to the third case. Across all workshops, the CRC engaged with long-term community residents in group discussions to map their local knowledge in a participatory manner. Before starting, facilitators provided a brief explanation of the Sketch Map Tool addressing questions about orientation and spatial references. During the exercises, participants collectively identified mainly areas of hazards, capacities and existing structures, like supply points or safe zones.
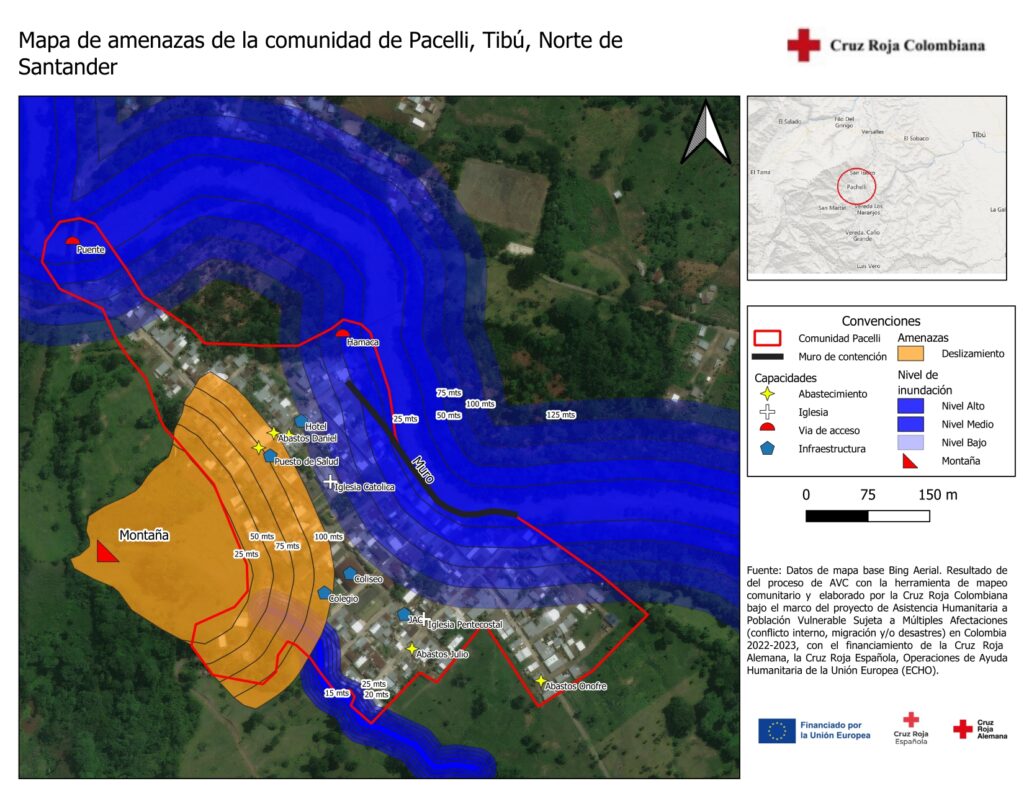
- Pacelli (Tibú, Norte de Santander)
December 2023
The Sketch Map Tool facilitated participatory mapping, enabling community members to localize and communicate local capacities in their territory, including available resources, supply infrastructure, evacuation routes and strategic points for emergency response.
- Monserrate (Arauca)
February 2024
The process began with a “Training of Facilitators” for Red Cross, Civil Defense and firefighters on the EVCA methodology, which included a practical session on the Sketch Map Tool. Following the training, the tool was applied in the field during a participatory “transect walk”.Participants used Sketch Maps to identify local capacities (resources, safe zones) and document flood risk perceptions (causes, affected areas). This on-site exercise allowed the team to ground-truth these insights, directly contrasting local knowledge and memories with physical observations to strengthen the collective understanding of the territory.
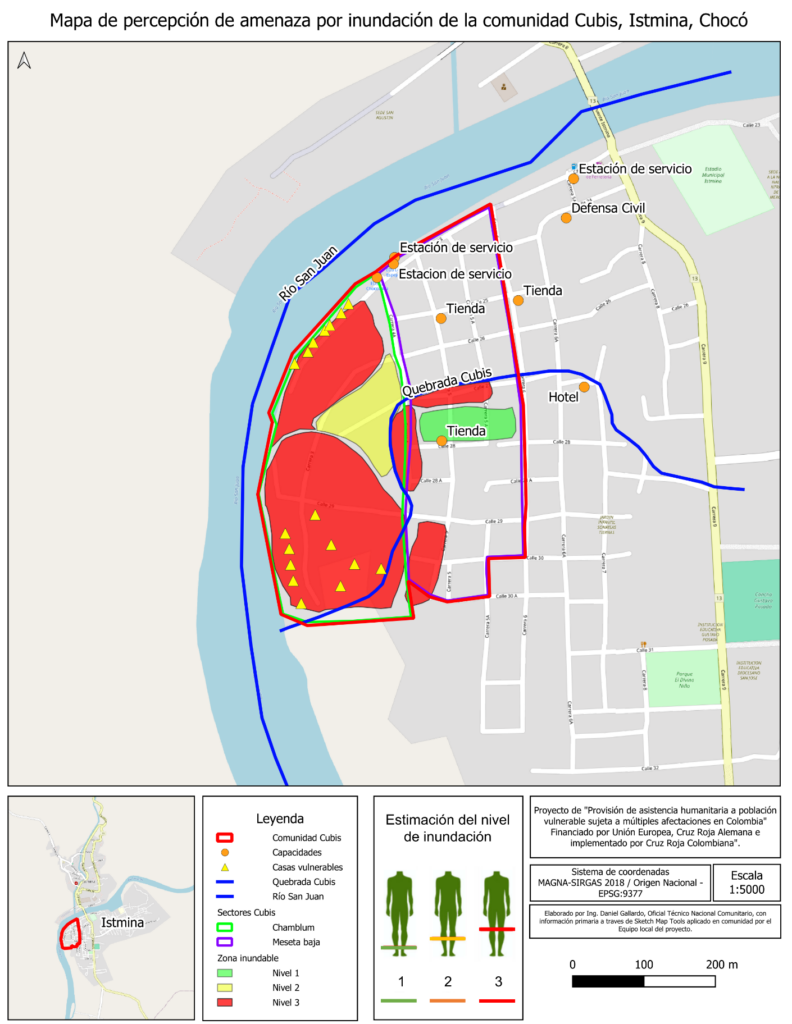
- Cubís (Istmina, Chocó)
September 2025
In this community, the team applied lessons from previous exercises to conduct participatory mapping of flood-prone areas and flood levels based on memories of historic flood events, vulnerabilities and risk perceptions. Different colours were used to mark the water levels perceived by the community, according to the height the water reaches (Level 1: ankle height; Level 2: slightly below the knee;Level 3: slightly above the knee). Here, unlike in Monserrate, the mapping was carried out as a group discussion with community leaders rather than through a “transect walk”,relying entirely on participants’ territorial knowledge to generate the sketch map.Furthermore, the incorporation of Sketch Map Tool improved the precision and systematic collection of spatial information, facilitating technical analysis. By making local knowledge digitally accessible, this automation empowered the community to leverage these maps as advocacy tools, enabling them to raise critical risk issues and ensuring the integration of their insights into formal Community Risk Management Plans.
How were the Sketch Maps analyzed?
Initially, the maps were digitized using the Sketch Map Tool to convert the hand-drawn markings into structured data. However, as the data analysts were not present during the field collection, discrepancies in interpreting the markings arose due to a loss of qualitative context. This necessitatedadditional field trips to ground-truth and validate the accuracy and quality of the initial digital results. Additionally, the GeoTIFF output was used as ground reference to manually add not detected information to the vector layer. Once validated, the findings were visualized as community maps; this final structured dataset facilitated a systematic analysis, enabling the clear identification of critical zones, local resources and institutional capacities within the territory. The process was complemented by historical risk profiles, seasonal calendars, semi-structured interviews, and focus groupto triangulate information, refine the interpretation of findings and consolidate the final community diagnostic results.
Results and Impact
The training of facilitators from institutions such as the Colombian Red Cross, Civil Defense, and the Official Firefighter Corps contributed to the generation of local capacities and the strengthening of inter-institutional work. The complementary use of participatory methods proved to be an effective strategy for integrating community knowledge with spatial analysis tools. Furthermore, the incorporation of Sketch Map Tool improved the precision and systematic collection of spatial information, facilitating technical analysis. By making local knowledge digitally accessible, this automation empowered the community to leverage these maps as advocacy tools, enabling them to raise critical risk issues and ensuring the integration of their insights into formal Community Risk Management Plans.
Lessons Learnt
The project demonstrated a clear progressive learning curve, highlighting both strategic successes and key areas for improvement. Community participation, institutional support and technological assistance allow for advancement toward more precise, inclusive and sustainable risk management processes at the local level. A primary strategic finding was that a high participation strengthened local ownership of the process. The group setting proved advantages by turning the mapping exercise into a collaborative validation process. Debates over historical events and locations allowed the team to clarify and validate reference points and to enter a two-way risk communication. By leveraging a diverse group composition and collective experience, the group could solve spatial uncertainties – such as defining distances or specific site – through consensus, ensuring a more accuratefinal map. However, the three case studies also revealed specific challenges that must be addressed. Future efforts should focus on the following key areas:
- A significant loss of qualitative context was observed when field facilitators and data analysts were different roles. Future projects require a structured handover protocol and improved institutional and community coordination to preserve this context (e.g. agreement on mapping methodology,create clear legends).
- While digitization was automated, manual corrections of the detected markings were required. Additional training in manipulating vector data in GIS software was needed in the local teams.
- Issues with automated marking detection highlighted the critical need for a formal data validation protocol (e.g., using the GeoTiff as a reference layer) to correct errors before the final analysis.
- Additional challenges emerged when some features were marked outside the Sketch Map margins or captured in low-quality photographs. These errors prevented the tool from correctly georeferencing the map, which meant it could not generate usable raster or GeoJSON outputs. These difficulties offered clear lessons for future applications, highlighting the need to strengthen capacities and knowledge in the use of the Sketch Map Tool.