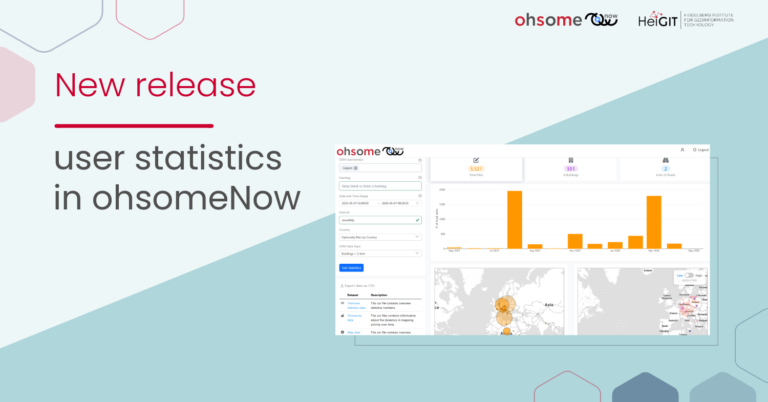
Today, we’d like to shine a light on the online tool OhsomeNowStats.
OhsomeNowStats allows users to take a look at the mapping activity in OpenStreetMap. This is especially useful for humanitarian organizations and mapathon organizers, because OhsomeNowStats data is updated every 5-10 minutes. Using this tool, user-engagement can be tracked in near real time and used to motivate participants and volunteers alike!
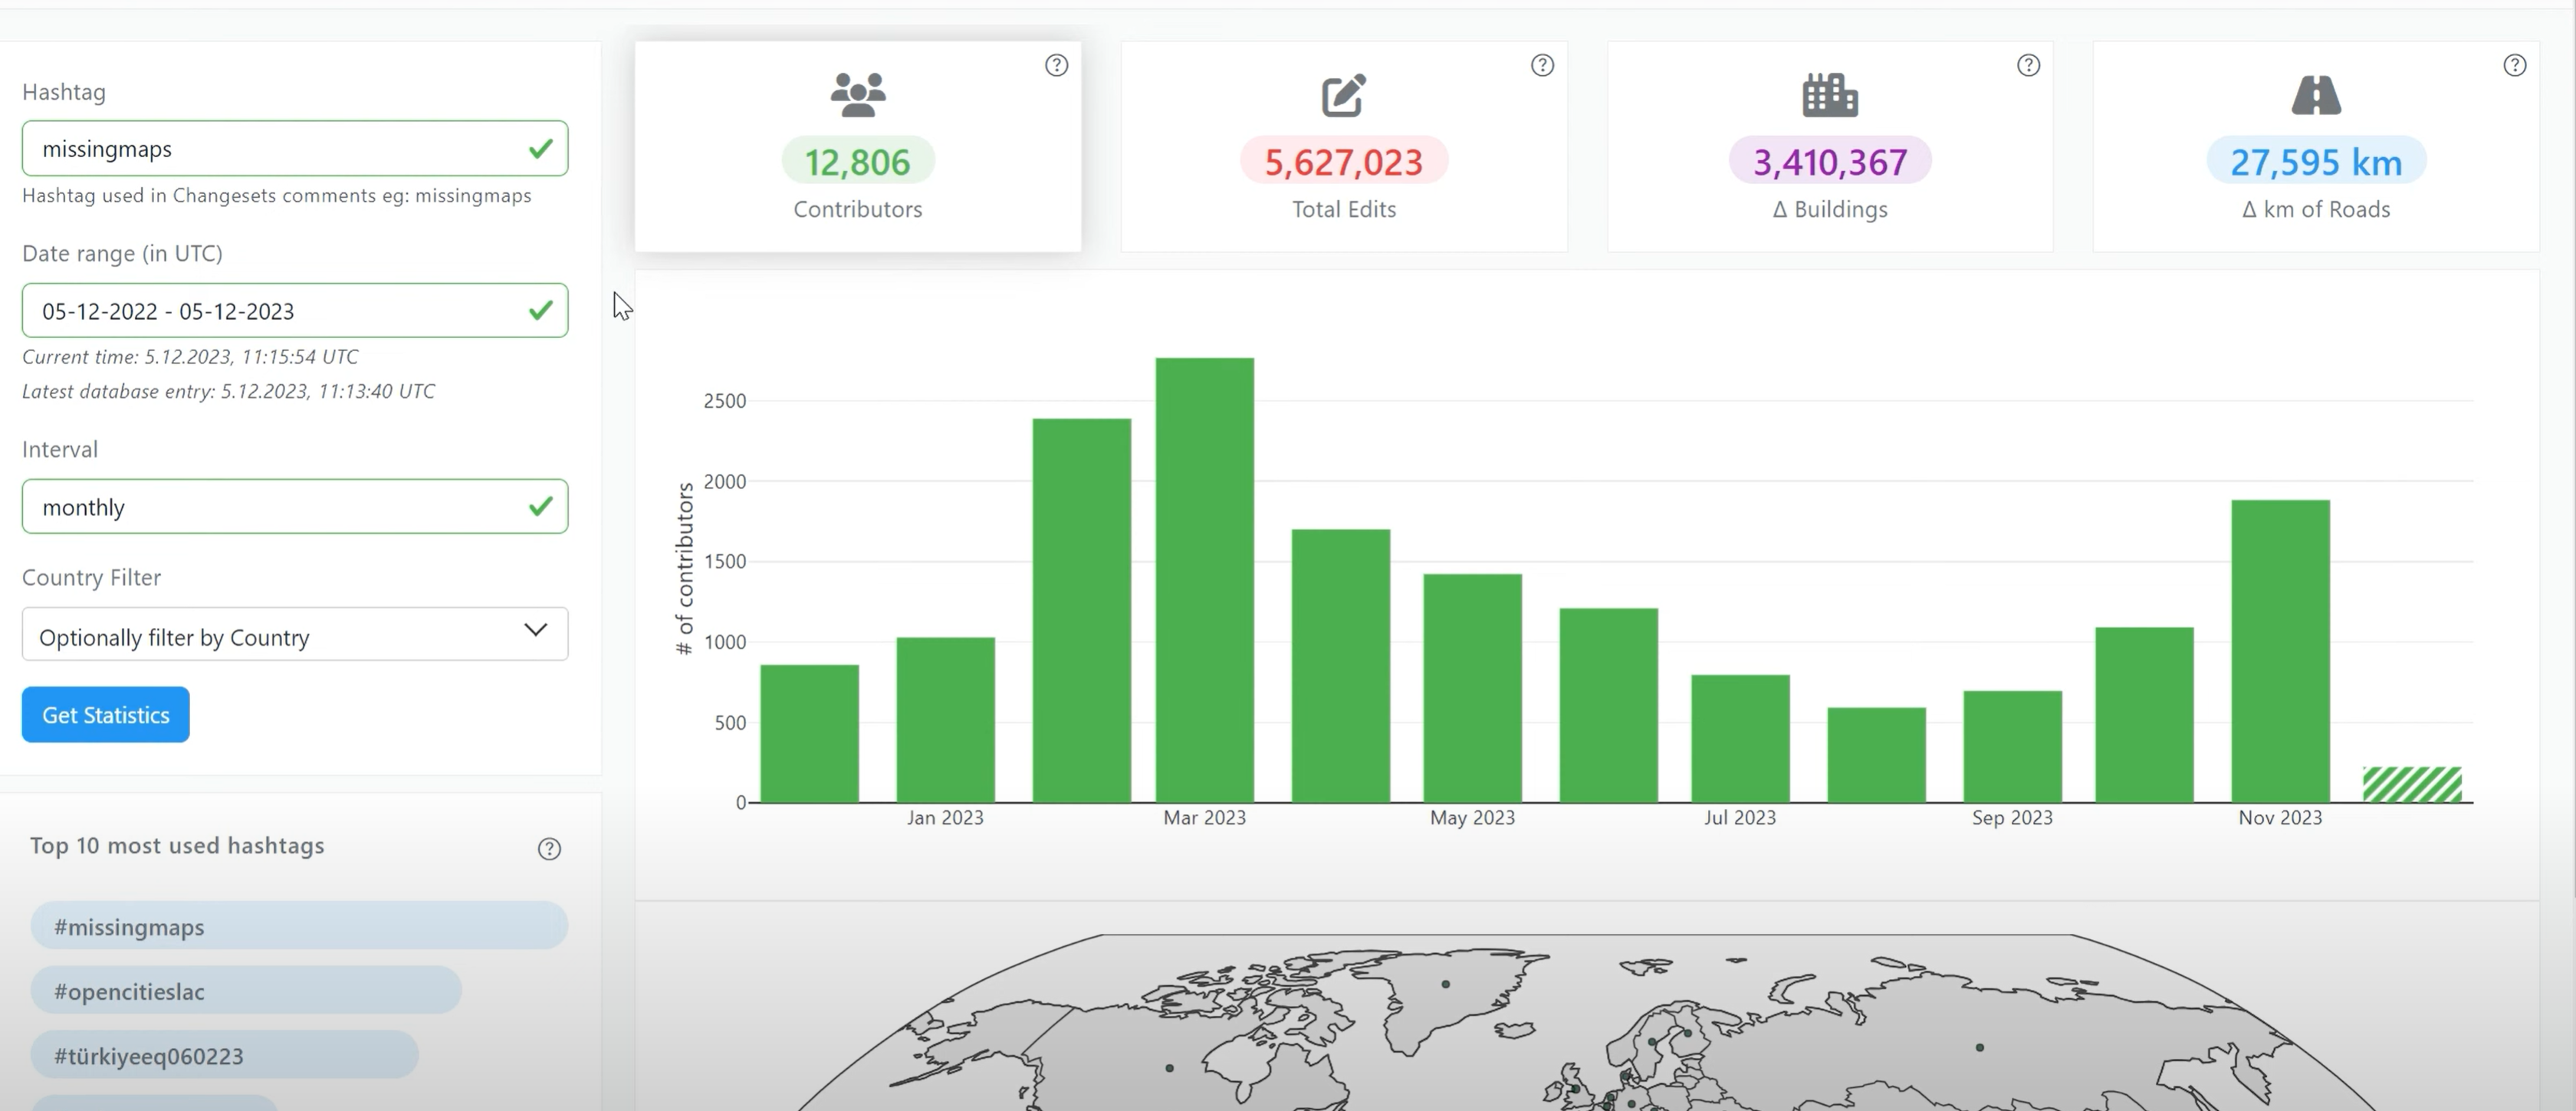
By selecting a time range, an interval, and an OSM hashtag, you can display the contributors, total edits, delta roads, and delta buildings of the mapping activity regarding that hashtag in your selected time range and interval. We recently also added the ability to display statistics by country, and you can view a list of the most popular OSM hashtags in your selected time range, if you scroll down a bit on the website. Once selected, OhsomeNowStats then visualizes these statistics as both a bar graph and a world map.
To explain how to navigate the tool, HeiGIT has recorded a tutorial video:
You can also find this video on Youtube. Follow us there, if you’re interested in further tutorial videos of our ohsome services! Want to learn more about interesting news and events related to the application of geospatial information in the fields of mobility, humanitarian aid and data analytics? Follow our social media channels and stay up to date on upcoming mapping, conferences and geospatial content with our blog!