Did you ever wonder how your city was mapped over time, how geometries were changed and refined, how mistakes were added and corrected again? Then read on: ohsomeHex has a great new feature for you – the individual object’s zoom-in-history-view.
To continue in providing valuable insights into the quality and development process of OpenStreetMap data, we are back with new functionality!
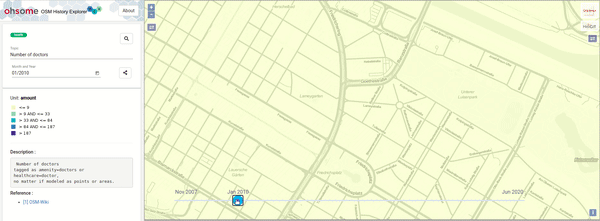
ohsomeHeX is a great tool to understand the evolution of OpenStreetMap data over years of a region. So far we aggregated thematic characteristics of objects to values on a hexagon grid, which makes it easy to understand spatio-temporal development patterns with a holistic global view. But sometimes accessing individual OSM features helps in gaining a deeper look. In this new version, we use the ohsome API’s full-history-extraction capability to display the changes of OSM geometries and tags according to our ohsomeHeX topics. This new view is automatically enabled when the user zooms into the map to zoomlevel 15 or higher. With the provided time-slider you can experience the changes of those features over time.
Let’s have a look on a few examples to see how useful this new functionality can be.
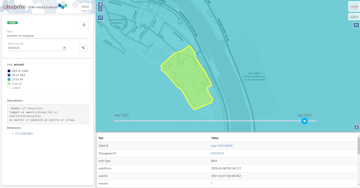
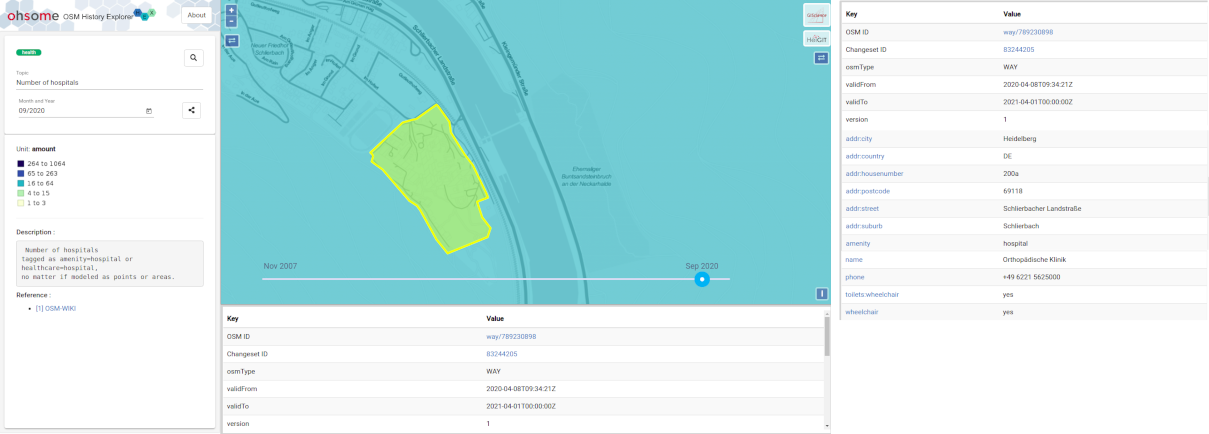
In some cases we can gain insight into a single feature’s geometry changes showing how many corrections have been made to perfect it. As seen by geometry changes of the Krehl-Klinik (hospital) of Heidelberg University
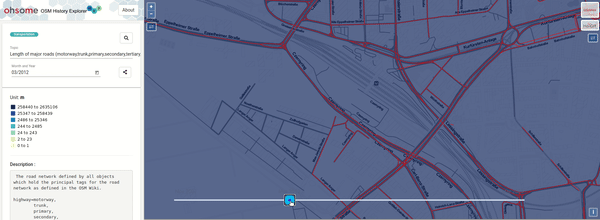
or in some case we can witness the infrastructure development of a neighborhood as seen in our “Length of Major roads (motorway,trunk,primary,secondary,tertiary,unclassified,residential)” layer. New roads have been added to OSM during early 2012 till 2014 in Heidelberg Bahnstadt area. This is an example of how active the OSM community is as the construction for this had started in 2011 and first residents moved in Summer of 2012
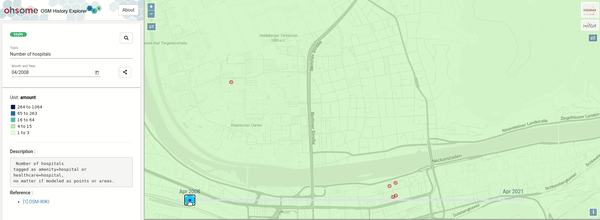
Another example of how the “Number of Doctors” hexagon tiles are changing their color due to addition changes that can be seen in bust of Doctors in Mannheim from 2011 onward
Not all topics are results of aggregation queries, some topics are generated by comparing two result-sets. E.g. the topic “Proportion of bus stops with wheelchair accessibility information” displays the ratio of bus stops which have Wheelchair accessibility information against all bus stops. For the zoom-in features this means we show both parts of the ratio in different colors. This allows the user to follow the completion of wheelchair information on bus stops over time by looking at the changing colors. In this example the features with tag “wheelchair=*” are denote by red color whereas features in cyan denote the bus stops which do not have a “wheelchair=*” tag.
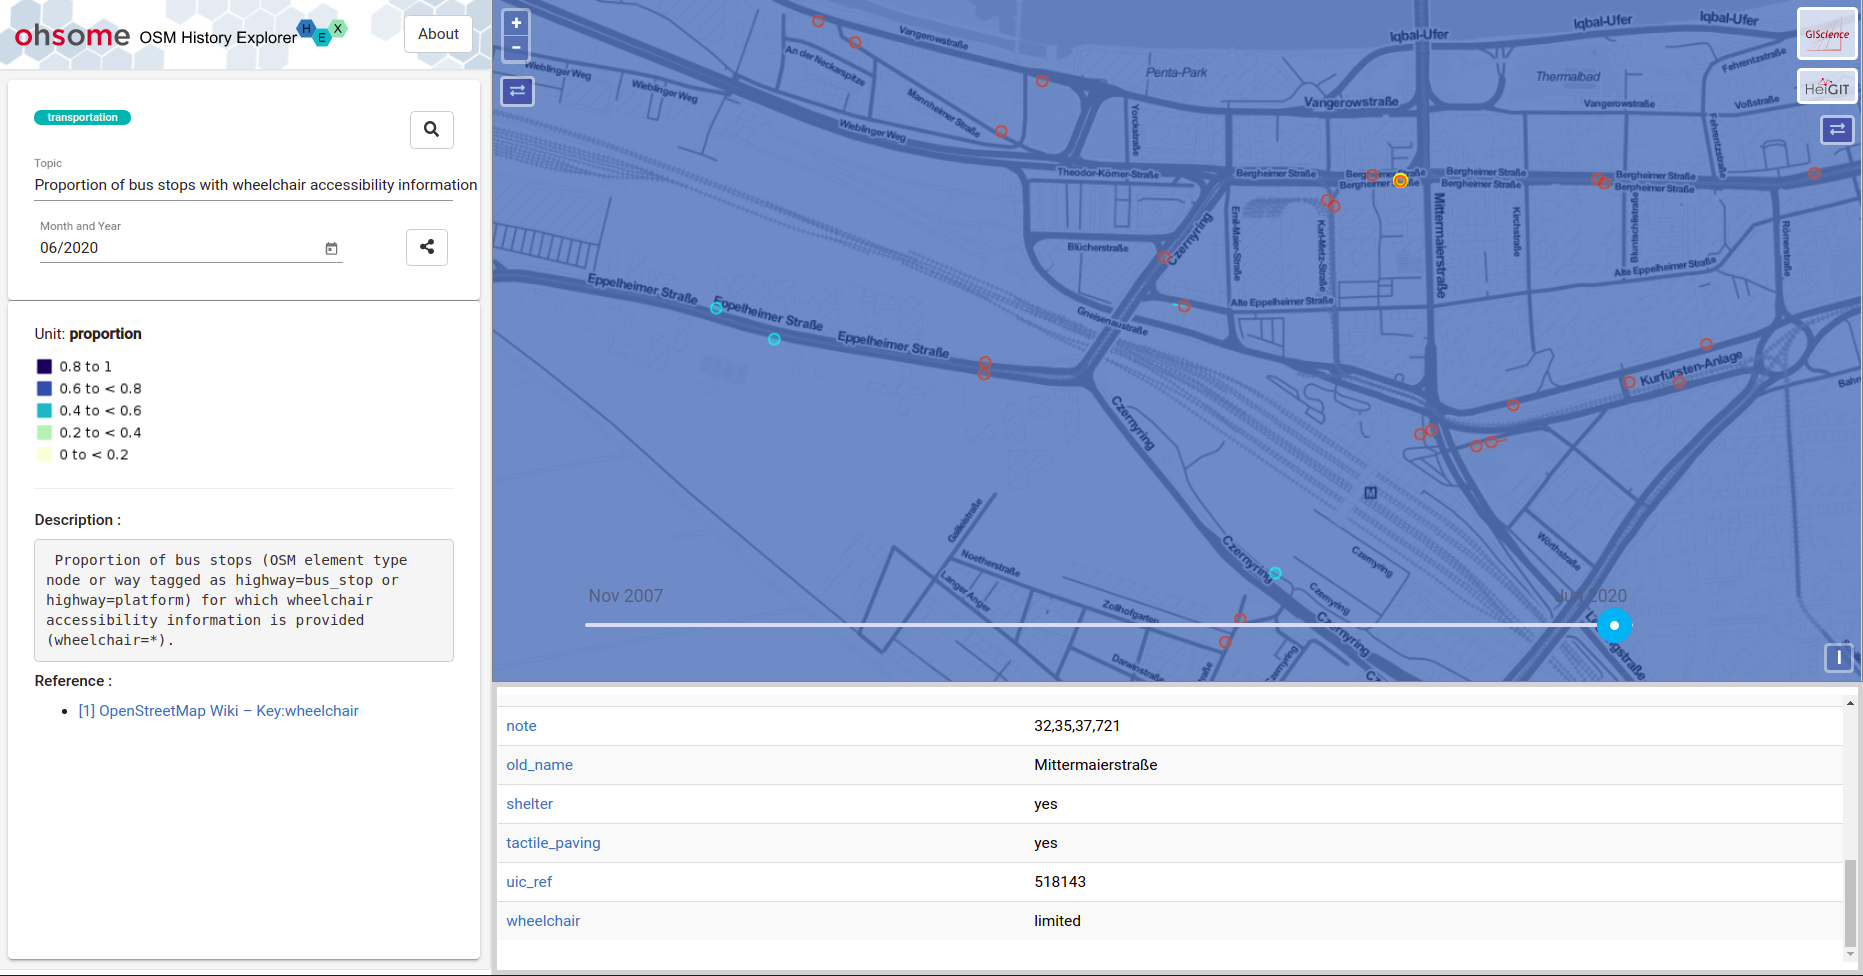
The individual history features can be clicked to get the feature’s tag information. Important metadata values like OSM IDs and Changeset IDs are linked to the OSM page and other tag-keys are linked to taginfo for further information.
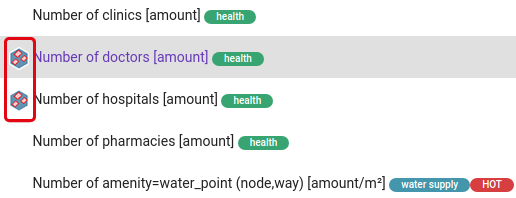
The availability of the new zoom-in-history is indicated by a special icon next to each topic in the Topic dropdown list.
We hope our efforts improve your experience with ohsomeHeX. We are looking forward to your feedback! Stay tuned for future updates and features. OhsomeHeX is based on HeiGIT’s ohsome API and it’s underlying OpenStreetMap History Database OSHDB.
If you want to know more about our ohsome framework, don’t hesitate to reach out to us via ohsome(at)heigit.org or contact any member of our team directly. Further Information on the ohsome OpenStreetMap History Data Analytics Platform and more examples of how to use the ohsome API can be found here:
- ohsome general idea
- ohsome general architecture
- the whole “how to become ohsome” tutorials series
- Scientific article on OSHDB
- OpenSource git repositories
- Further publications