Since the release of the ohsome quality analyst (short OQT) in February of last year, we have been working on developing an accessible yet powerful toolkit which provides end users insights on the quality of OpenStreetMap (OSM) data. An overview of the functionality additions made to OQT over this time period can be found in the changelog. However, for this blog post, we wish to introduce two more recent additions in functionality. The recent changes expand the flexibility of the API and transferability of the data provided for humanitarian organisations, public administrations, as well as researchers and other institutions.
HTML Snippets
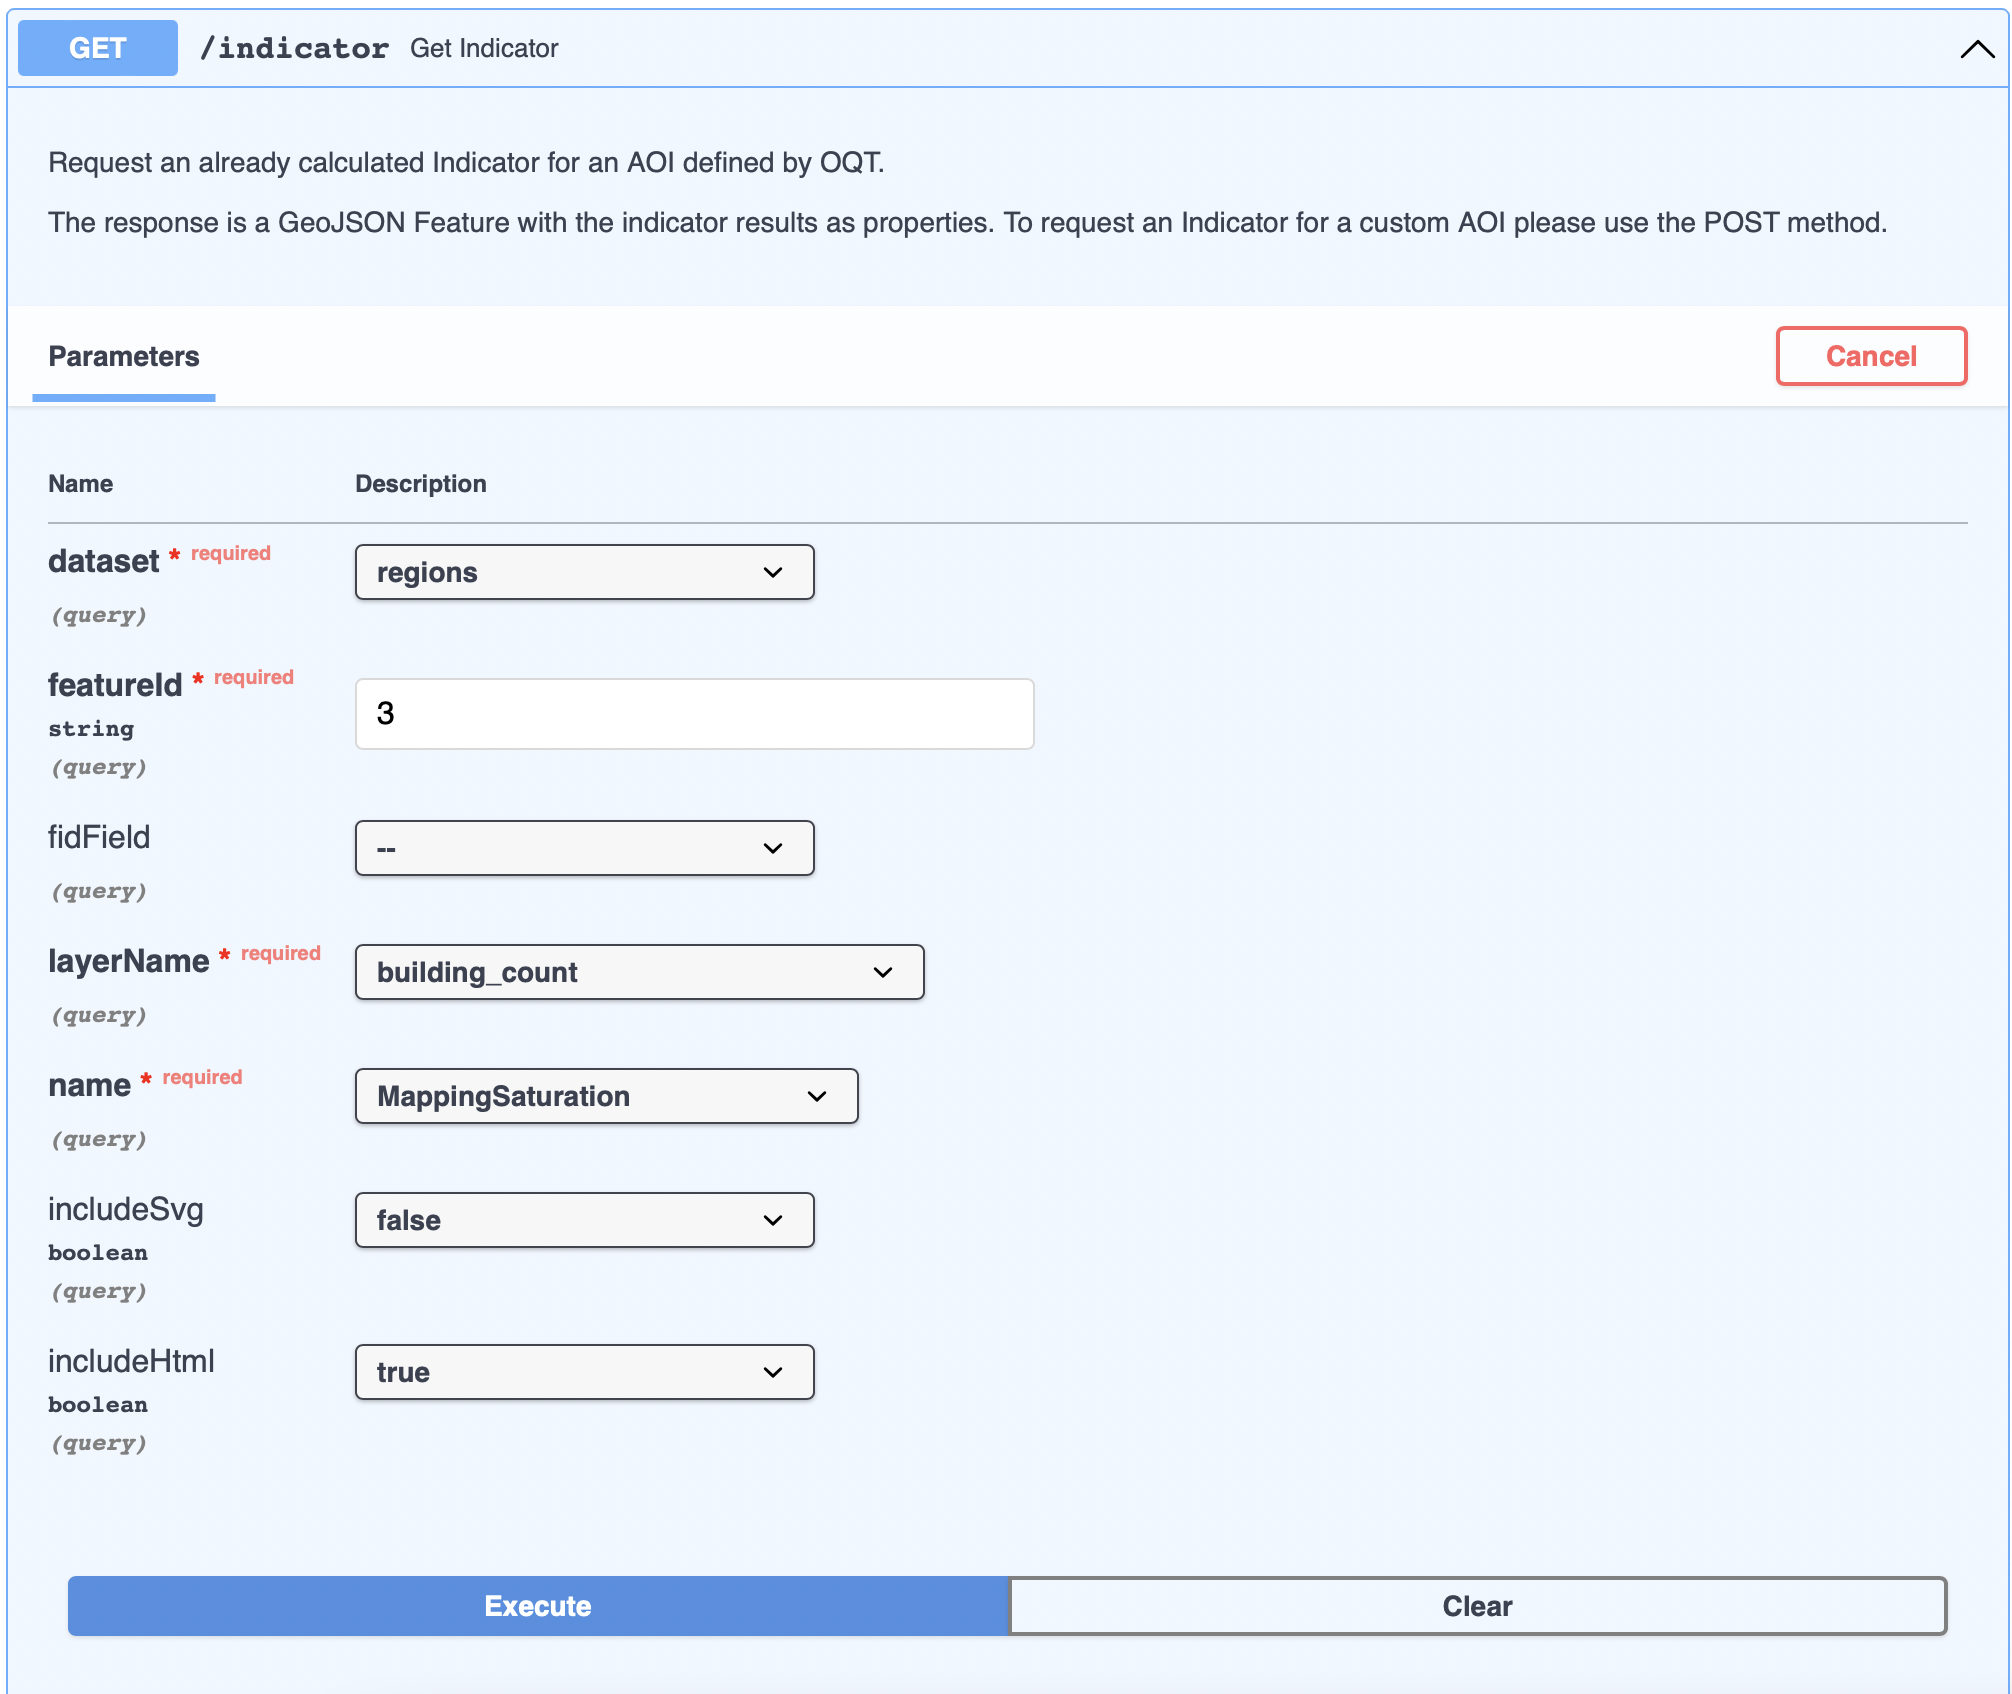
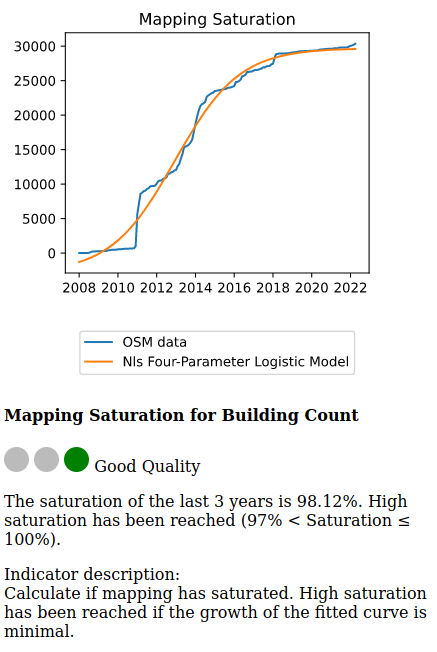
Our initial idea behind OQT was to show the quality of OSM data in an easily comprehensible manner. A new feature of the release 0.9.0 is an API response to be retrieved as an HTML snippet. This snipped presents the end user with a visual representation of the indicator results such as threshold curves and the OQT-traffic-light labelling schema which provides quality information on a respective indicator. Primarily, this makes it easier to embed a given API response on a webpage for sharing user results. This functionality is either accessible through the web application or Command Line Interface.
Understanding the functionality of the HTML snippet can easily be described in an exemplary API GET request through the interactive Swagger interface for the API (See left figure below). Once executed, the HTML snippet is found in the properties of the GeoJSON response. Embedding this snipped in an HTML document will look like the image on the right hand side of the figure below. We hope that this new functionality allows OQT Indicators or Reports to be used in a versatile way outside the OQT website.
Expanding Data Input options
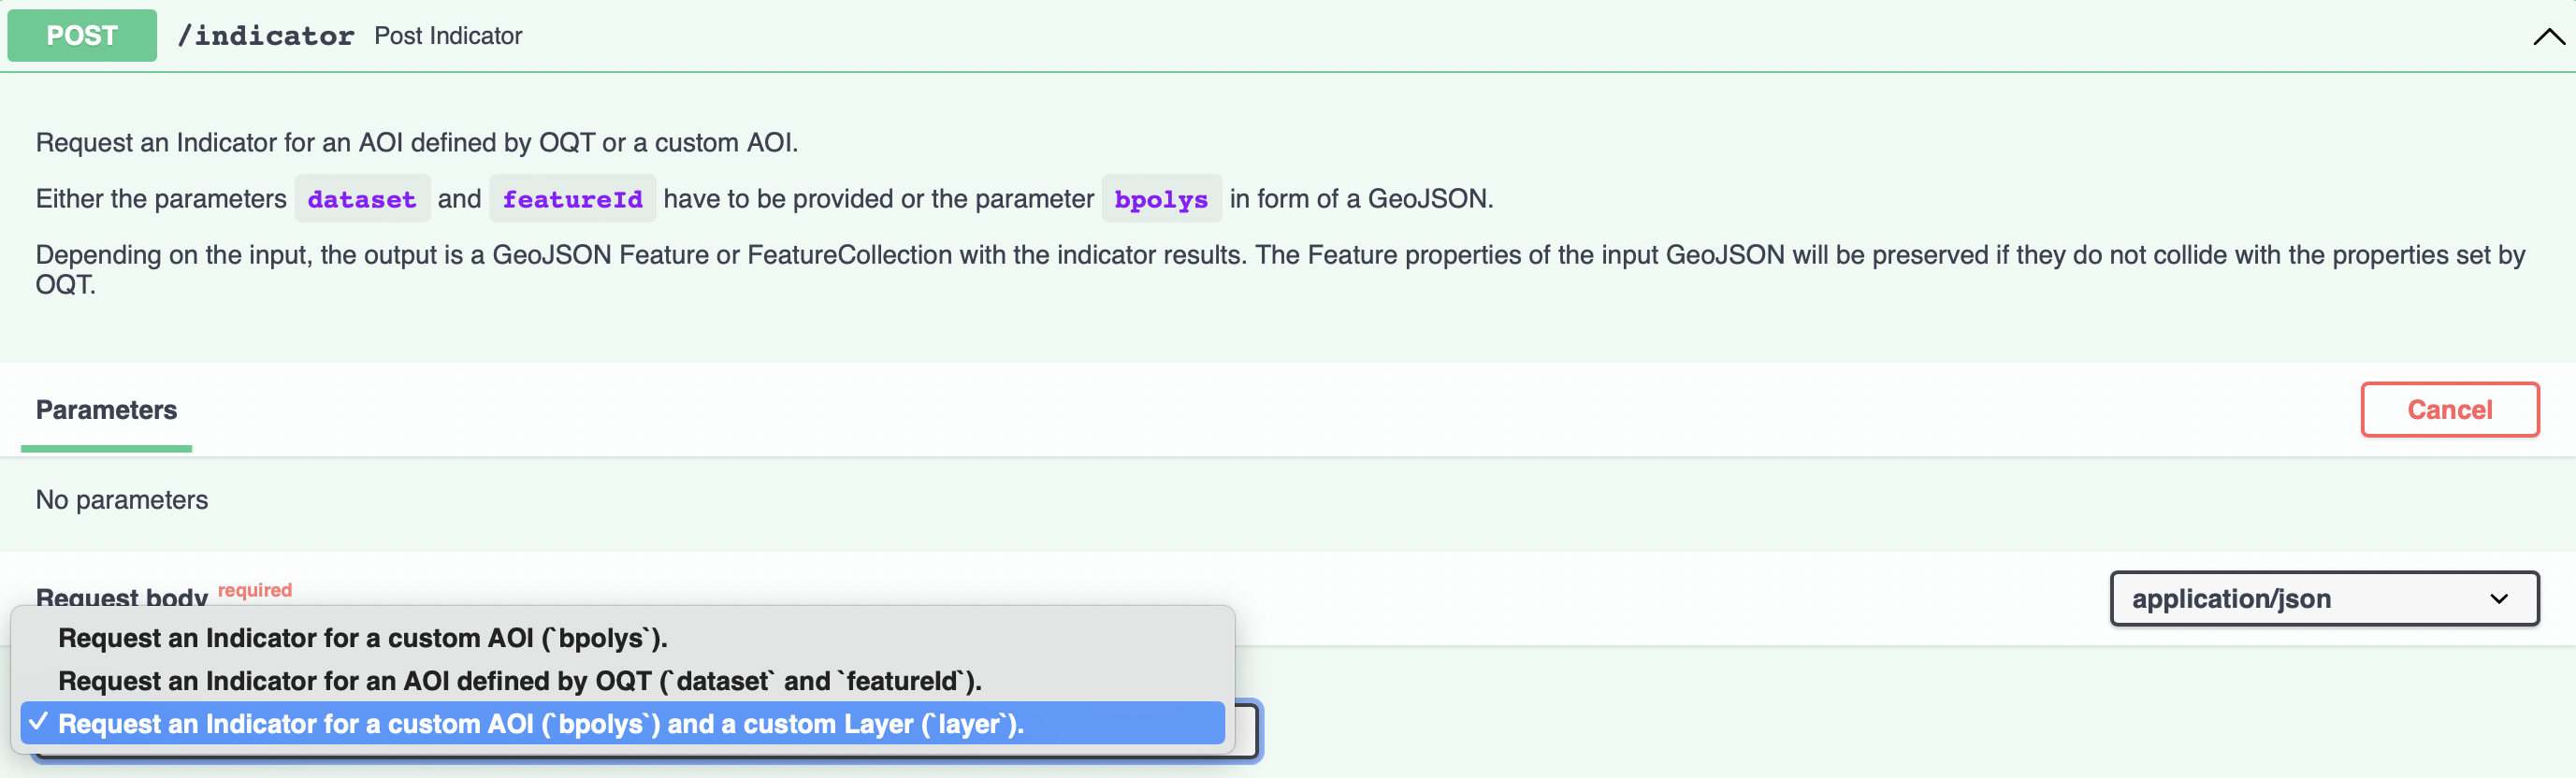
A second new feature worth highlighting is the possibility for a user to provide the OSM data as input when requesting Indicators from the OQT API. This is useful for cases where the user already has the OSM data. For requests using a custom AOI as input to the OQT API providing the OSM data itself will lead to a much faster computation of the indicator.
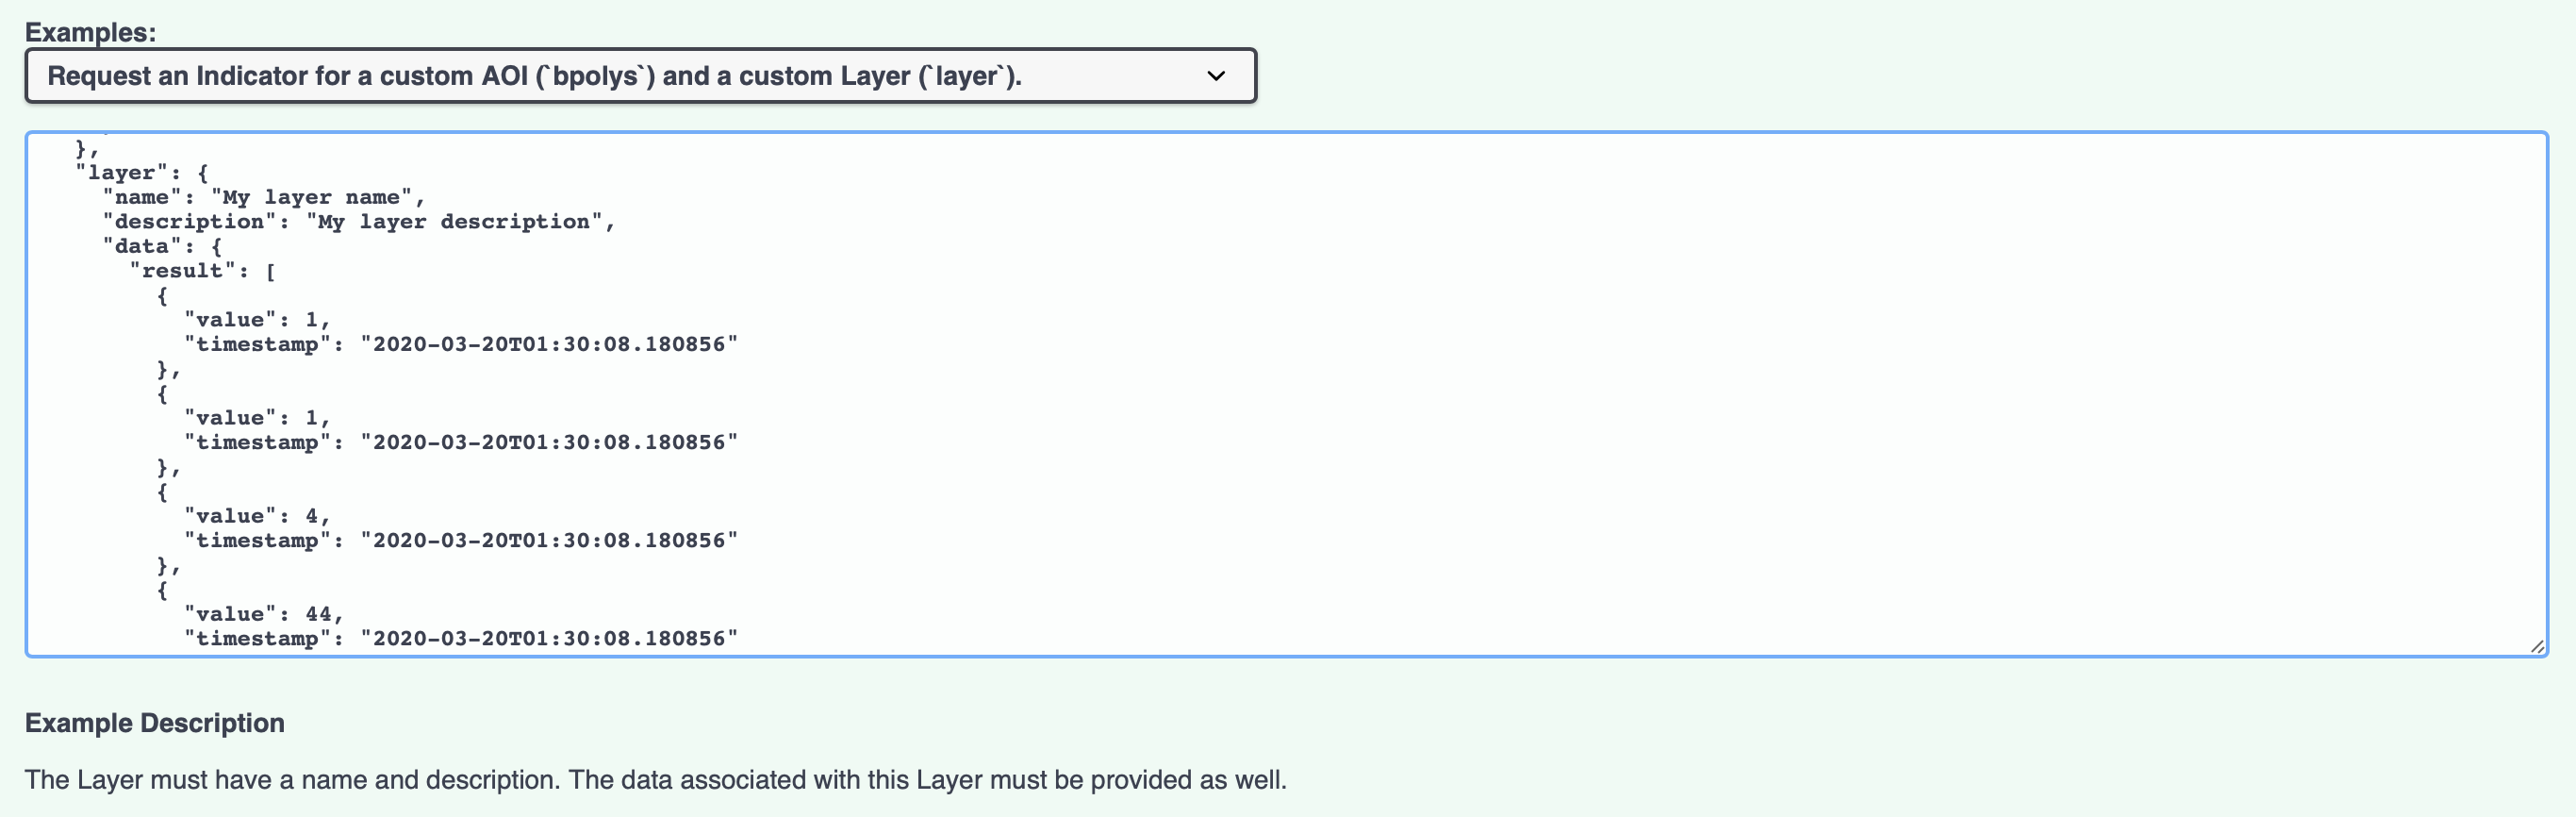
In practice, to make use of these features the user has to define a custom layer object and use it as a parameter of a request to the API. A layer consists of a name, a description and the OSM data. The format of the OSM data has to match the structure of the ohsome API request response.
An example request can be found on the interactive Swagger interface of the API.
Once selected, a sample request body is displayed. Have a look at the structure of the data field. It resembles the result field of an ohsome API response.
Currently, this feature is restricted to requests for the Mapping Saturation indicator. It is planned to make this feature available for all indicators and eventually for reports as well. If you would like to use it for another indicator, please reach out to us!
Final Notes
In addition to those new features to OQT various smaller changes have been made, all to be found in the changelog. If you have any ideas, feedback or would like to contribute to OQT feel free to contact our team via ohsome@heigit.org. OQT is Open Source and the development is done on GitHub where contributions are welcome.
The further development of OQT of course does not end here. We have a couple of interesting new additions in the pipeline, one of them being a new Building Completeness indicator which uses machine learning to predict the completeness of buildings in OSM for a certain Area of Interest.
Related Work
OQT relies on OSM data processed by the ohsome framework developed at HeiGIT. The aim of the ohsome framework is to make OSM’s full-history data more easily accessible for various kinds of data analytics tasks, such as data quality analysis, on a regional, country-wide, or global scale. Here you find a list of related blog posts and publications:
Blogposts:
- Introducing the ohsome quality analyst (OQT)
- Behind the scenes of the ohsome quality analyst (OQT)
- The ohsome quality analyst goes public on Github with new release 0.3.0
- ohsome general idea
- ohsome general architecture
- blog series how to become ohsome
- Workshop about ohsome framework at Foss4G 2019
Publications
- Raifer, Martin; Troilo, Rafael; Kowatsch, Fabian; Auer, Michael; Loos, Lukas; Marx, Sabrina; Przybill, Katharina; Fendrich, Sascha; Mocnik, Franz-Benjamin; Zipf, Alexander (2019): OSHDB: a framework for spatio-temporal analysis of OpenStreetMap history data. Open Geospatial Data, Software and Standards.
- Herfort, B., Lautenbach, S., Porto de Albuquerque, J., Anderson, J., Zipf, A.The evolution of humanitarian mapping within the OpenStreetMap community. Scientific Reports 11, 3037 (2021). DOI: 10.1038/s41598-021-82404-z https://www.nature.com/articles/s41598-021-82404-z
- Schott, M.; Grinberger, A. Y.; Lautenbach, S. & Zipf, A. (2021) The Impact of Community Happenings in OpenStreetMap – Establishing a Framework for Online Community Member Activity Analyses In: ISPRS Int. J. Geo-Inf. 10, no. 3: 164. https://doi.org/10.3390/ijgi10030164
- Grinberger, AY, Schott, M, Raifer, M, Zipf, A. (2021): An analysis of the spatial and temporal distribution of large‐scale data production events in OpenStreetMap. Transactions in GIS. 2021; 00: 1– 20. https://doi.org/10.1111/tgis.12746