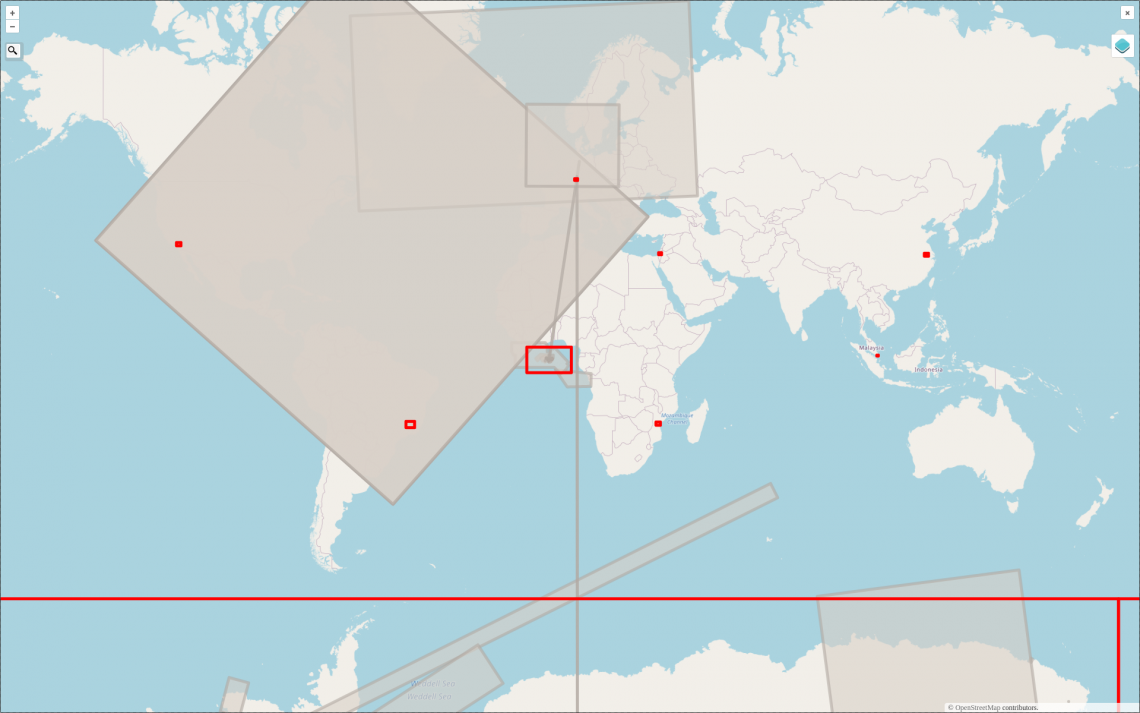
Featured photo: The deleted map displays all deleted elements within the analyzed areas (red). Gray rectangles represent deleted buildings.
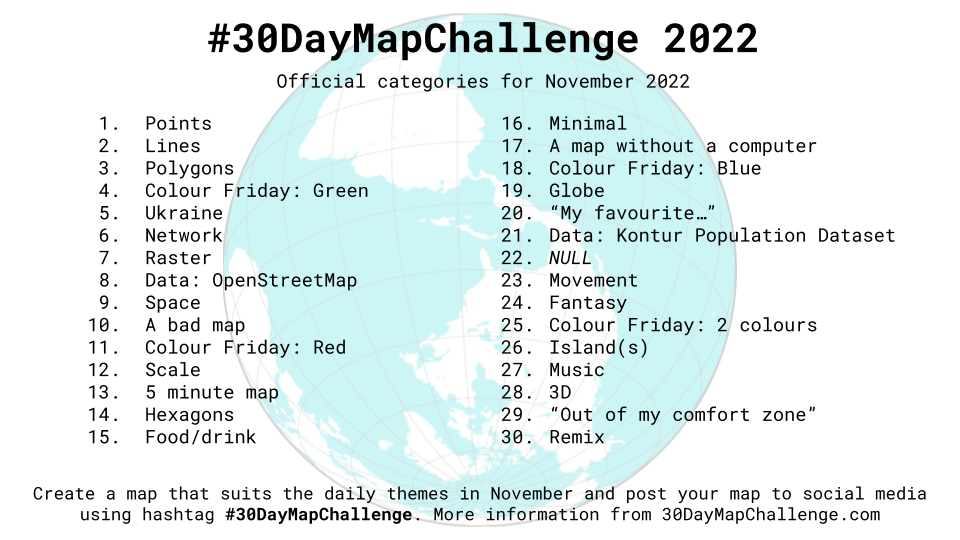
This past November, our teams at HeiGIT and GIScience participated in Topi Tjukanov’s Twitter event #30DayMapChallenge, where mappers display their creativity and ingenuity with a set of 30 daily prompts ranging from colors to specific datasets to geometric limitations in any sort of map one can imagine. The challenge runs for the entire month of November and has been active since 2019.
As we eagerly anticipate the next round of mapping, we’re looking back at our contributions to last year’s challenge. In this series, we’ll speak to some of the mappers to gain insight into the colorful, innovative, and downright stunning submissions from last November. You can read part one, which looked at three versions of Germany produced by HeiGIT researcher Jakob Schnell, here.
Next up is our submission to Day 22, NULL. The term describes “No Data” (as opposed to 0 – zero) in many programming languages and therefore offers a wide range of interpretations. Our team’s contribution was to visualize deleted or invisible data from OpenStreetMap (OSM), meaning data that had been NULLed by the mappers. The idea stemmed from a feature request for deleted objects from HeiGIT’s OpenStreetMap History Database (OSHDB) project.
To understand the contribution, one must consider the geographical area around the coordinate (0,0), often referred to as NULL-island. Technically, this location is arbitrary- the Greenwich-meridian (prime meridian or 0-meridian) was chosen for historical rather than geographical reasons. Nevertheless, the location is often used as a “default” or trash-can location. As you can see below, OSM is no exception.
Day 22’s NULL challenge was tackled by Moritz Schott and Rafael Troilo. Moritz Schott is a Research Associate at the GIScience Research Group working on the IDEAL-VGI project, while Rafael Troilo is a Research Associate on HeiGIT’s Big Spatial Data Analytics team with a focus on software development, database and high performance developing/programming, spatial data analysis and visualization.
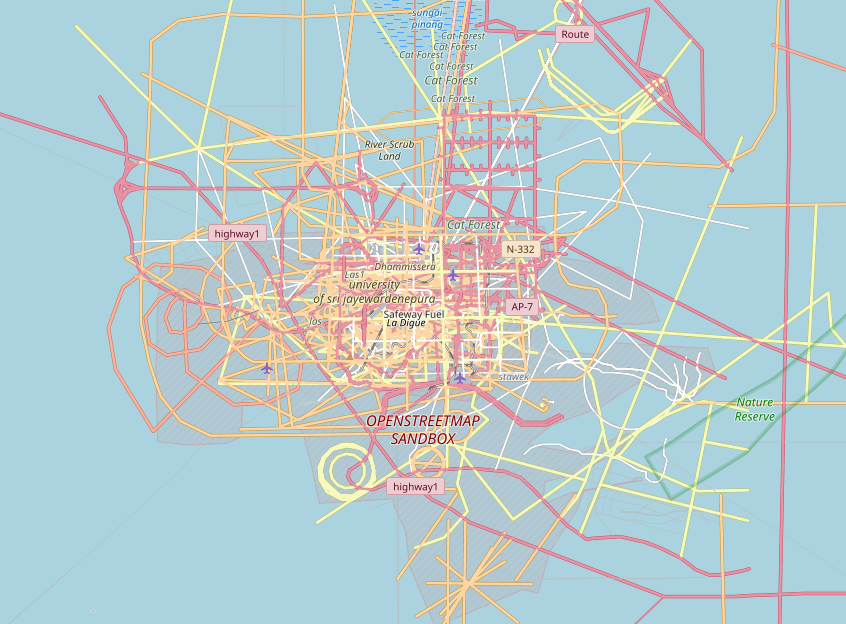
The two researchers took the prompt significantly further than one map. They created a full workflow that first extracts deleted elements from OSHDB. In a second step, the geo-data in OGR compliant format is transformed to the OSM data format using the ogr2osm tool. Finally, the resulting data is rendered using the recommended setup from switch2osm.
You can check out and explore the results, pictured below, on the Deleted OSM Elements web page and GitLab.
We asked Moritz Schott some questions about the idea and execution of the prompt, with plenty of useful advice for mappers and the mapping community overall.
What inspired your map?
At first, it was only curiosity, but then the practical implications became more and more apparent. I am an OSM contributor as well as a data analyst. When I did historical analyses, I was aware that the history of an element is limited but it was when I saw this data and the redrawing of buildings and farmland in and around Heidelberg that I realised that this could be an issue. That’s why I chose to add the “pre-historic-coverage” indicator to the OSM Element Vectorisation Tool. The tool calculates many data aspects and quality indicators for single OSM elements.
What’s the future of the project?
We will do more research on the topic, but anybody is welcome to join our path. And if you are aware of any regions that have interesting deleted elements, feel free to reach out through email (communications@heigit.org) or GitLab. We will see if we can add them to the map.
What should people take from your map?
-
Don’t vandalise, the community has enough work
-
Being an open project is a major cornerstone to the success of OSM and many errors get fixed very fast. The question is if the community could agree on some edit restrictions to reduce the number of obvious errors (e.g. at NULL island) and if that would just redirect the issue to other locations?
-
Try to improve instead of delete-redraw while mapping
-
The history of an element is useless if not seen within the history of a region
Is there anything else you would like to add?
We are thankful for the rich possibilities provided by the community in the OSM ecosystem that enabled us to create this workflow and were happy to implement a few small pull requests to the code base of these tools.
And please don’t vandalise! This was fun but also more effort than expected due to the mess the community thankfully cleaned up. But we dug it up and had to cope with it again…
Clearly, research avenues abound both for mapping generally and for the results of this contribution to the 30 Day Map Challenge. Stay tuned for the next installments of our look back on 2022’s entries, with music, beer, and watercolor to come!