Sketch Map Tool (SMT) – An easy-to-use way to create and digitalize paper maps for offline data collection in the field
The HeiGIT (Heidelberg Institute for Geoinformation Technology) team recently launched a new version of the Sketch Map Tool – an easy-to-use tool for participatory sketch mapping through offline data collection, digitization and georeferencing of local spatial knowledge.
Thanks to the support of the German Red Cross and funding from the German Federal Foreign Office, a more stable and user-friendly version of the HeiGIT/GIScience tool has now been developed.
What is special about the Sketch Map Tool?
The variety of mapping methods already in use demonstrates the importance of the spatial aspect of local knowledge and perception for project planning. At the same time, accessing and recording spatial perceptions of community members with existing online and offline data collection tools remains a significant challenge.
The Sketch Map Tool addresses this prevailing need by facilitating the mapping of local knowledge, perceptions and wishes on paper based maps, the so-called Sketch Maps. With the help of a base map, participants can easily orientate themselves. By uploading the marked maps to the Sketch Map Tool online application, the uploaded map and collected data are automatically georeferenced and digitized.
This automatic transfer from analogue to digital data saves a large amount of time and simplifies the analysis of field data with other data sources like satellite images, flood models or additional vulnerability data. The Sketch Map Tool provides an opportunity to close the gap between local experiences and more abstract geoinformatics analysis. The tool supports every important step of participatory mapping, from the creation of the base map and the analysis of its suitability for participatory mapping to the digitization of the results.
How Do I Use the Sketch Map Tool?
The tool, through a user-friendly interface and setup as well as supporting and training materials, enables the usage and involvement of interested stakeholders with multiple levels of expertise and tech experience.
Step 1: Map Creation
In the first step, the Sketch Map Tool allows you to create sketch maps based on Open Street Map (OSM) data for your area of interest. With the background map, the participants can orientate themselves on streets and central locations when collecting data.
Since OSM is a participatory project to create a global geodatabase, additional map data and thus its quality can be improved in cooperation with the OSM community if required. The integrated quality analysis of the OSM base map data by the HeiGIT ohsome quality analyst provides users with information on the usability of the map through a traffic light system as well as further analysis and recommendations.
The Sketch Maps can be created and printed in different paper sizes to support different capture options. For example, larger paper sizes are optimal for mapping in groups, while smaller sizes are preferred for mapping individually.
Step 2: Mapping in the Field
Sketch maps can be used for local mapping directly in the areas of interest and collaborative mapping in workshops. The circumstances, facilities or areas to be recorded are marked with a pen or marker.
Step 3: Digitalization
After data collection, the marked sketch maps can be photographed or scanned and uploaded to the Sketch Map Tool. This is followed by automatic georeferencing as well as identification and digitization of all markings. The Sketch Map Tool then makes the complete map and all markers available for download in digital formats.
In more technical terms, the tool will start the automatic georeferencing of the maps and color detection of the marked features. These results can be downloaded as geodata (GeoTIFF and GeoJson) and further analyzed in the Geographic Information System software of your choice.
This step requires hardly any technical knowledge and avoids much manual work and thus valuable time. In addition, the analysis of the recorded data and a simple link to other data sources such as satellite data or flood models is made possible. The Sketch Map Tool offers a way to bridge the gap between local knowledge and experience and more abstract geographic simulations and modelling.
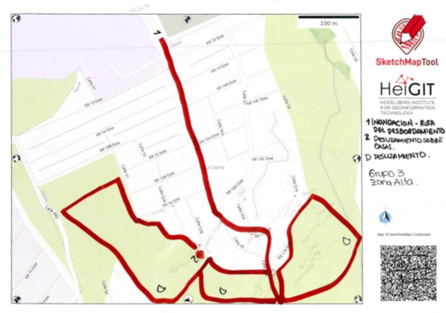
Figure 1: Sketch Map of Risk Areas from a project in Colombia (Letzner 2023).
Selected use cases of the Sketch Map Tool
The Sketch Map Tool can be used by local stakeholders to engage communities in gathering information about their experience and perception of previous flood events or other hazards in their neighborhoods. In the past, the tool has been used by various actors in risk assessments, to design risk reduction measures, or to enhance communication by increasing risk awareness among citizens.
The development of the first prototypes of the Sketch Map Tool started over four years ago in the Waterproofing data project to support the collection of flood risk perception in two vulnerable Brazilian communities.
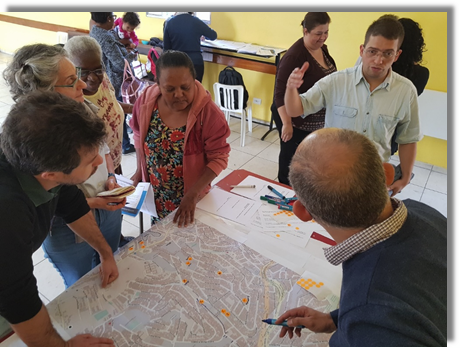
Figure 2: Brazil (Klonner 2019)
Since then, the tool has been tested in different contexts and projects around the world including Germany, Mozambique and Madagascar. In Mozambique, for example, users recorded flood areas and regions with increased crime using the Sketch Map Tool in workshops. The collected data was used in disaster risk reduction projects by the German Red Cross and Mozambique Red Cross Society.
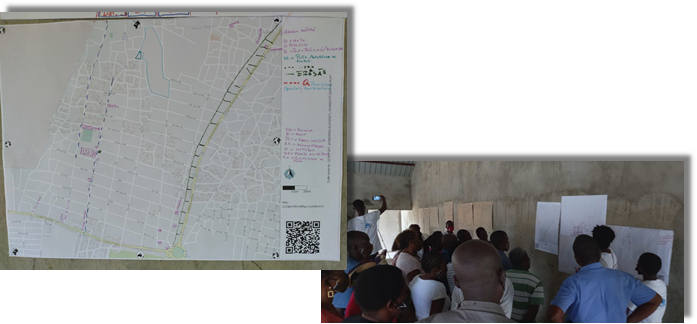
Figure 3: Mozambique (György 2022)
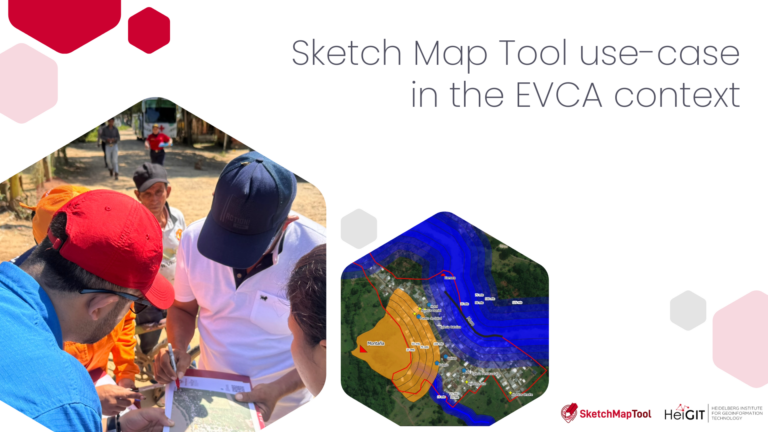
Currently, our former HeiGIT intern Kimon Letzner explores the potential and limitations of the Sketch Map Tool in the scope of his Master’s studies at Lund University. His focus is on the community mapping process in the context of the Enhanced Vulnerability and Capacity Assessment (EVCA) in the International Red Cross Red Crescent Movement based on a project with the Colombian Red Cross National Society.
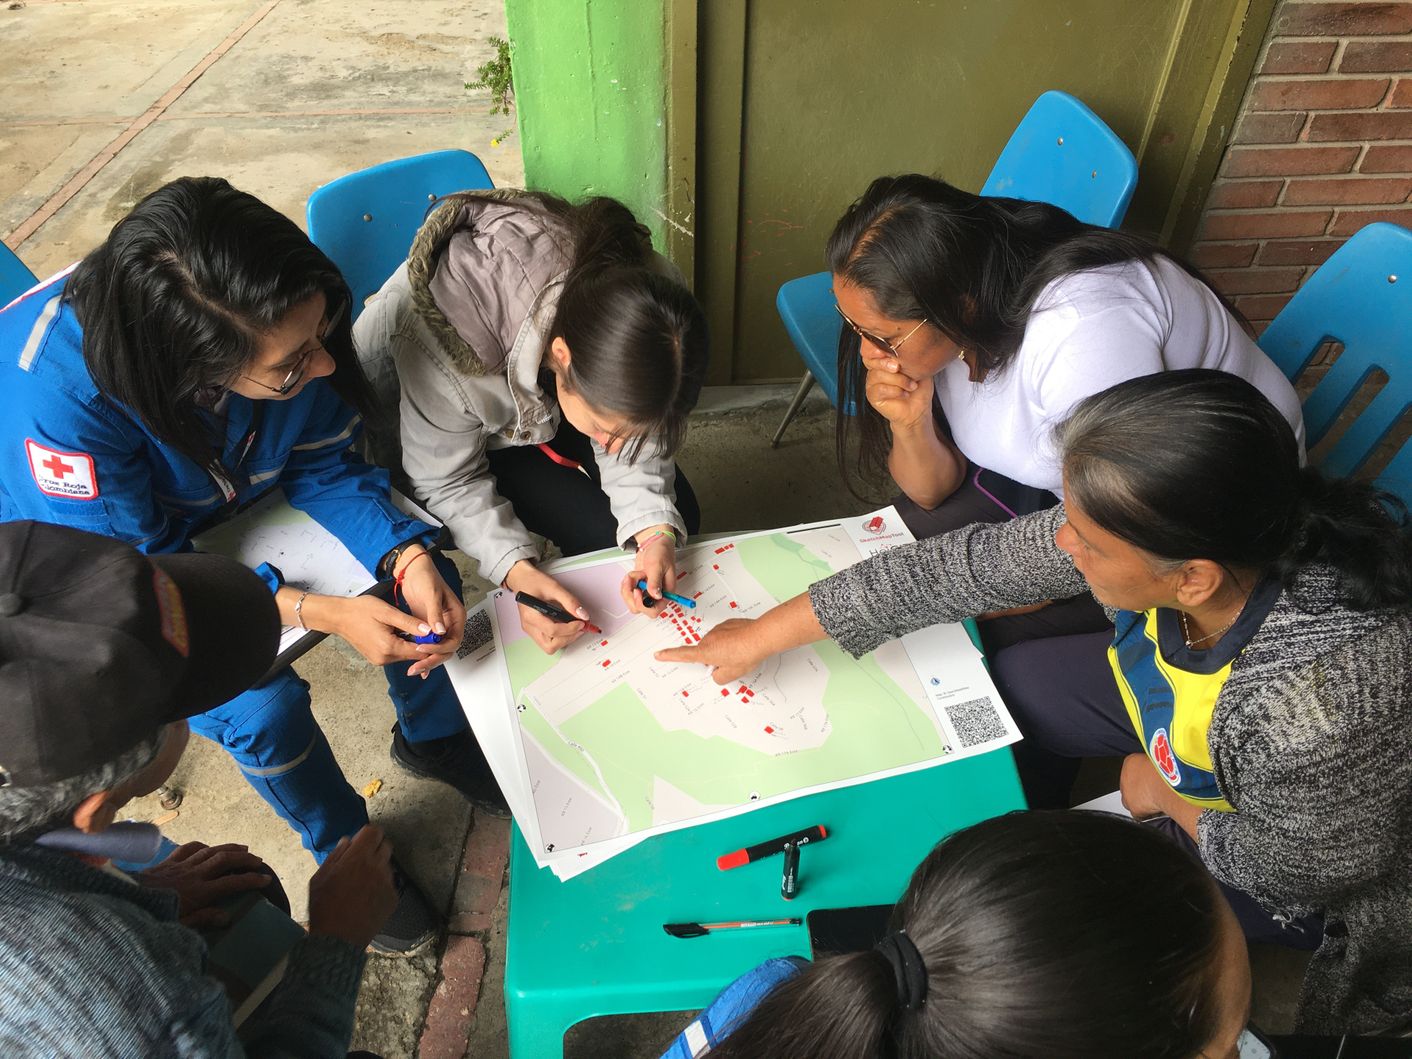
Figure 4: Community mapping (Letzner 2023)
In May 2023, the Sketch Map tool was presented and used in a practical exercise at a regional training of the International Federation of Red Cross and Red Crescent Societies “Road Map to Community Resilience via Enhanced Vulnerability and Capacity Assessment (EVCA)” in Kuala Lumpur, Malaysia. A write-up of the training can be found here. This event represented another crucial step towards implementing the tool in the standard processes of the Red Cross Red Crescent Movement worldwide.
Outlook
The application examples presented here represent only a small part of the current projects in which the Sketch Map Tool has already been deployed. Due to the Sketch Map Tool’s functions and the easy handling of the tool, the HeiGIT team receives consistent information and ideas about applications and further development from the Red Cross and Red Crescent Movement and beyond. In cooperation with our partners, we are also currently conducting numerous workshops and training on the Sketch Map Tool and planning updates and expansions for the application.
On Friday, June 9th at 4:30 PM EST, the Sketch Map Tool will be presented at the State of the Map US 2023, the annual OSM conference in the USA, with additional information available here.